Last week, in the first part of this Data Deep Dive, we looked briefly at how the percentage of scores in different ranges has changed since 2013. Today, we delve deeper into trends in college scoring over the last decade, looking in particular at how the distribution of scores has changed.
Occurrence of 9.9+ Scores
Beyond scores of non-fall routines and solid 9.8s, we questioned how the occurrence of the prized 9.9+ scores changed. We did so by looking at the percentages of 9.9+ scores from three different angles: event, week and location.
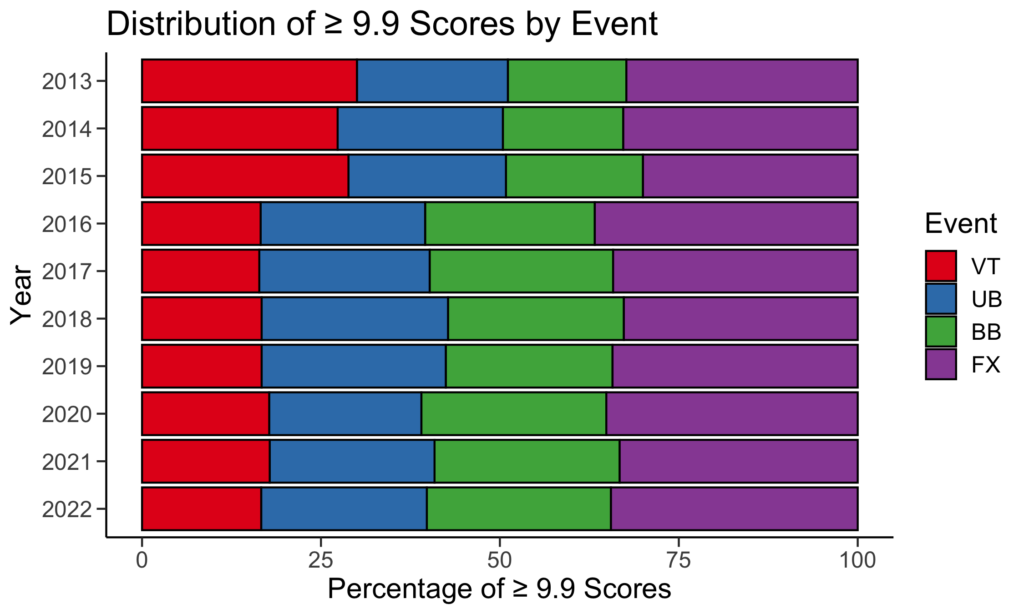
In terms of scoring trends by event, we looked at how the 9.9+ routines of a given season were distributed across the four events. The most obvious change shown in the bar chart above is the sharp decrease in 9.9+ scores on vault starting in 2016, likely a result of the devaluation of the Yurchenko full. When this happened, a share of 9.9+ scores previously achieved on vault shifted towards beam and floor, which saw increases from 19.1% to 23.7% and 30.0% to 36.7% of the season’s 9.9+ scores respectively. Since this change, the distribution of 9.9+ scores across events has remained largely unchanged, though in the last three years there has been a slight uptick in the percentage of 9.9+ scores on beam to about 25.7%. Correspondingly, the percentage of 9.9+ scores on floor has declined to about 34.3%, but it remains the event with the highest percentage of 9.9+ scores.
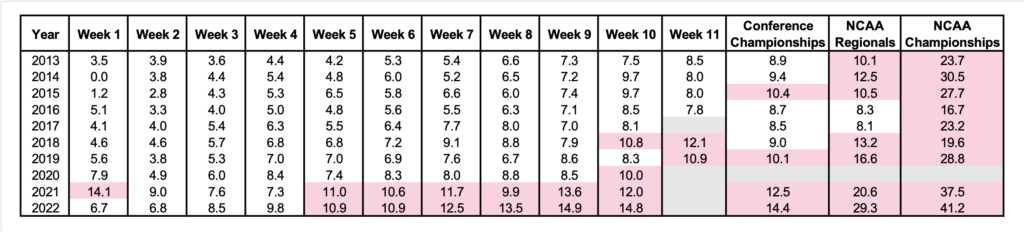
Switching to weekly scoring trends, we calculated the percentage of routines in a given season and week that scored a 9.9 or better, with the goal of determining the point in each season at which scores began to rise. We focused on weeks in which at least 10% of routines achieved a 9.9 or better, as highlighted in pink. Clearly, scores began to rise much earlier in the 2021 and 2022 seasons than in the eight seasons prior — beginning in Week 5, more than 10% of routines scored 9.9+ every week. This was in stark contrast to the first half of the decade, where the 10% threshold was not reached until the week of conference championships, at the earliest. Moreover, a whopping 37.5% of routines in 2021 and 41.2% of routines in 2022 scored 9.9 or better at the NCAA Championships, surpassing the previous high of 30.5% of routines in 2014. These percentages may help to explain the impression that inflated scores have increasingly become an issue — coveted 9.9+ scores no longer seem to be special rewards largely isolated to the postseason, but rather, achieved more regularly throughout the season.
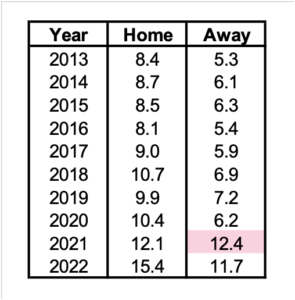
Pivoting to scoring trends by location, we were curious about scores for routines competed at home, as compared to that for routines competed at away meets. We calculated the percentage of home meet routines that scored 9.9+ each season, and performed similar calculations for away meet routines. As expected, scores of 9.9 or better were usually more common at home, though interestingly the percentage of 9.9+ scores at away meets slightly exceeded that at home meets in 2021. Combining this observation with our earlier finding that 2021 saw the largest increases in the percentage of scores in the 9.9 to 9.95 and 9.95 to 10 ranges, it is likely that this boost in away meet scores lifted the scores for the 2021 season overall.
Overall Changes to Scoring
Finally, we considered overall changes to scoring by looking at some summary statistics. The violin plot below shows the distribution of 9.7+ scores for each of the last 10 seasons, with narrower parts of each plot indicating scores that were awarded less frequently and wider parts indicating scores that were awarded more frequently. Crosses have also been included to show the median score recorded in each season.
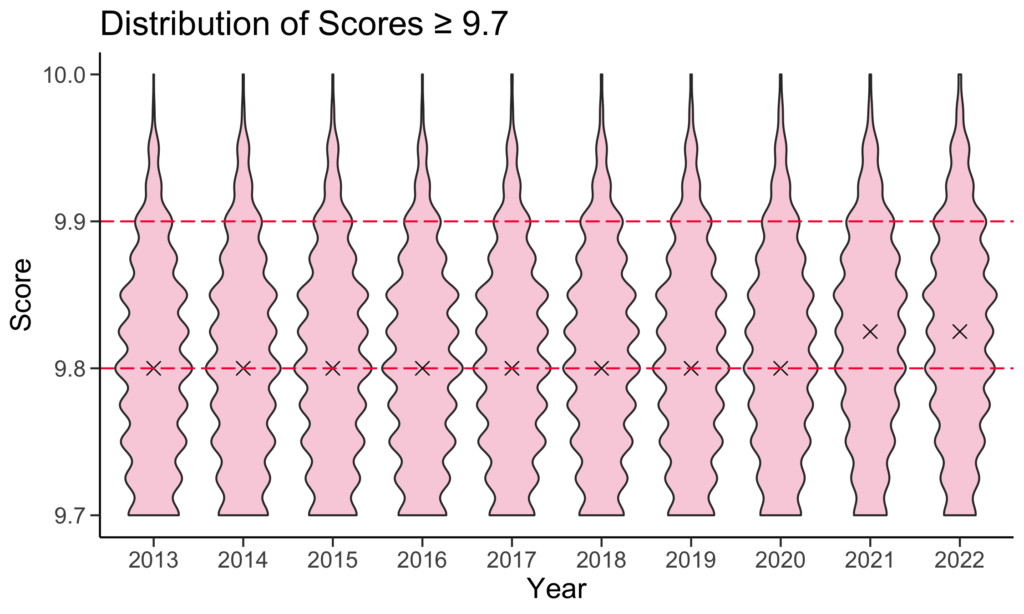
Looking at the widths of these plots, we observe that the top-most section of the 2021 and 2022 plots appear wider than those of the other seasons, once again providing evidence that 9.9+ scores were awarded more frequently in the past two seasons than before. But perhaps more interesting is the narrowing of the bottom-most section of these plots. Whereas the plots for the earlier seasons vaguely resemble pyramids — narrower at the top and wider at the bottom, the 2021 and 2022 plots seem to be narrower at both ends and wider in the middle, forming a convex shape. This could suggest that 9.7+ scores for the 2021 and 2022 seasons were more bunched together, with less separation between routines than in previous years. Furthermore, the median scores for the last two seasons were noticeably higher than that for the eight seasons before them, lending weight to the claim that college scoring is on a rising trajectory.
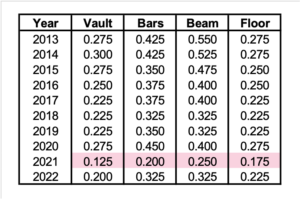
To better understand the possible bunching of scores observed in the plot above, we looked at the interquartile ranges of scores for each season, by event. The interquartile range is the difference between the 25th and 75th percentile values; in this case, it gives an idea of how varied the scores in each season, on each event, are. Highlighted in pink are the smallest interquartile ranges on each event — indicative of seasons where more bunching occurred. As shown, the smallest interquartile range on each event was observed in the 2021 season, confirming our earlier suspicion. The interquartile ranges observed in the 2022 season, while not as extreme as those observed in 2021, were also on the lower end for each event.
Discussion
A persistent finding of our analysis thus far has been the deviation of the 2021 and 2022 seasons from scoring trends earlier in the decade. One thing to bear in mind, however, is that a number of teams were either limited in, or entirely missed out on, the 2021 season due to the pandemic. As such, the scores analyzed for the 2021 season were disproportionately contributed by teams which experienced little to no reductions of their competitive schedules.
To get a sense of how the results of certain analyses might change if we accounted for this fact, we generated scores either to simulate the 2021 season for teams which did not compete at all, or to supplement the scores of teams whose seasons were limited. We did so by sampling from among the scores achieved by these teams in 2018, 2019, 2020 and 2022, giving preference to scores achieved in years that were closer to 2021. Through this sampling process, we constructed data in which the proportion of scores contributed by each team to the scores analyzed for the 2021 season more closely resembled the mean of that proportion across the other nine years. Using this data, we obtained the following line graph for the percentage of scores which reached or exceeded the indicated thresholds.
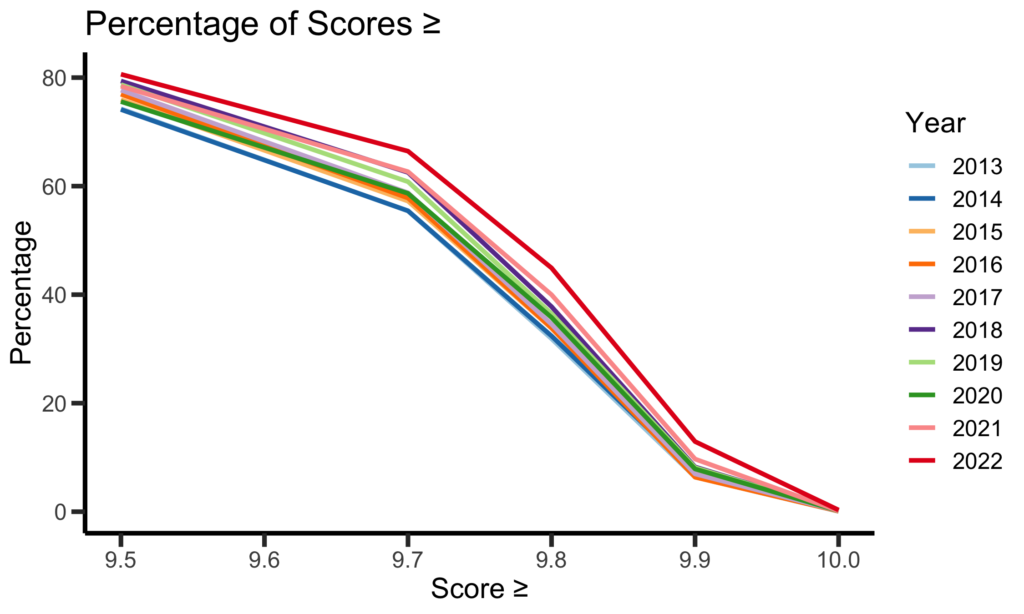
When we performed this analysis earlier, without accounting for the extent to which teams were able to compete in 2021, the pink 2021 line lay above the red 2022 line for the 9.5, 9.6, 9.7 and 9.8 thresholds, and was nearly indistinguishable from it for the 9.9 and 10 thresholds. In contrast, when accounting for the disparity in access to competition opportunities among teams in 2021, the red line lies above all others at all thresholds, more strongly affirming the widely-held sentiment that scores rose sharply in the 2022 season.
Coming Up Next
This concludes our broad analysis of scoring changes in college gymnastics over the last decade. In part three, coming next week, we’ll begin to tackle questions about if and how scoring changes have impacted gymnasts equally across the board.
READ THIS NEXT: Data Deep Dive: Scoring Trends of the Last Decade, Part 1
Article by Dara Tan and Emma Hammerstrom
Like what you see? Consider donating to support our efforts throughout the year! [wpedon id=”13158″]