Last week, we examined how scoring changes affected teams and gymnasts differently, based on what conference they were competing in. Today, in the fourth and final part of this Data Deep Dive, we continue our analysis of how scoring trends impacted gymnasts differently, by combining our scoring data for the last decade with information on gymnasts’ class standing and events competed. Class standings were primarily obtained from Road to Nationals (which codes both seniors and graduate students as seniors) and supplemented with information from individual schools’ rosters. We deemed a gymnast as having competed on an event in a given year if they recorded at least three away scores and at least six scores overall on that event, in that year. A handful of scores that were recorded without the gymnast’s name on Road to Nationals were dropped for this analysis.
Trends by Class Standing
Another lens to analyze the scoring trends of the decade was looking at how the scores of individual classes changed throughout the decade. We compiled a table with the average individual scores in a conference by class standing, aka freshmen, sophomores, juniors and seniors. To provide an overall comparison of the classes, a trend line for each class was plotted to compare how the average scores for each class changed throughout the decade.
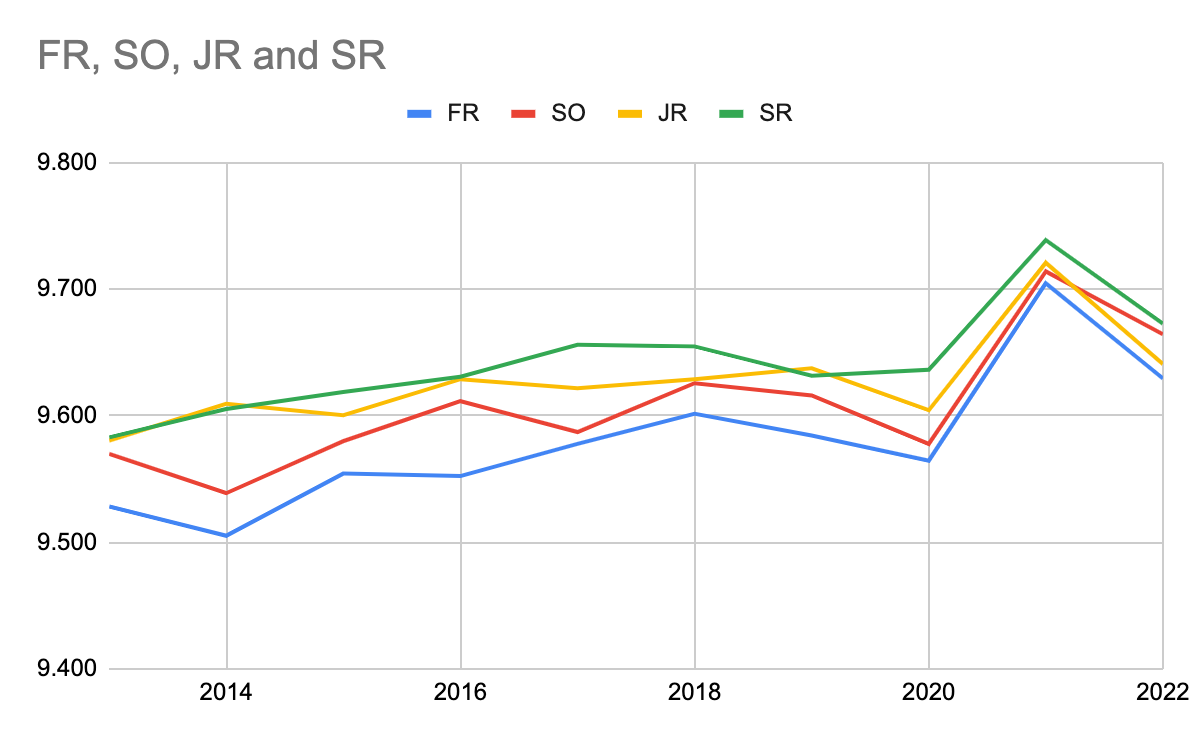
An interesting note is that only underclassmen scores peaked in the 2022 season, meaning that upperclassmen scores tended to deviate from the norm of scores generally rising in the past two seasons. This could be attributed to the quality of the entering 2022 class, partially due to deferments from elite gymnasts who had aimed to make the Tokyo Olympics. Upperclassmen scores were variable in their highs and lows based on conference, with only the Big Ten having both its average junior and senior scores peak in 2022. Decade lows were also variable across the board.
Looking at how the classes all compare, there is a very noticeable peak in 2021 following a steady rise of average scores across the decade. For the most part, seniors have notched the highest average scores of all of the classes.
To analyze scores by class over the decade a bit more in depth, we can also look to the spread of scores by class. To do this, individual box plots were created for each class’s scores overall throughout the decade, meaning each box plot is made up of every score for that class from the entire decade. The outer prongs of the box plot represent the minimum and maximum score earned for that class. The top of the box represents a 75th percentile score, the bottom represents a 25th percentile score and the inside line represents the median score. The point denoted with an X is the mean score for the class. These points were then connected to provide a comparison of mean scores between the classes.
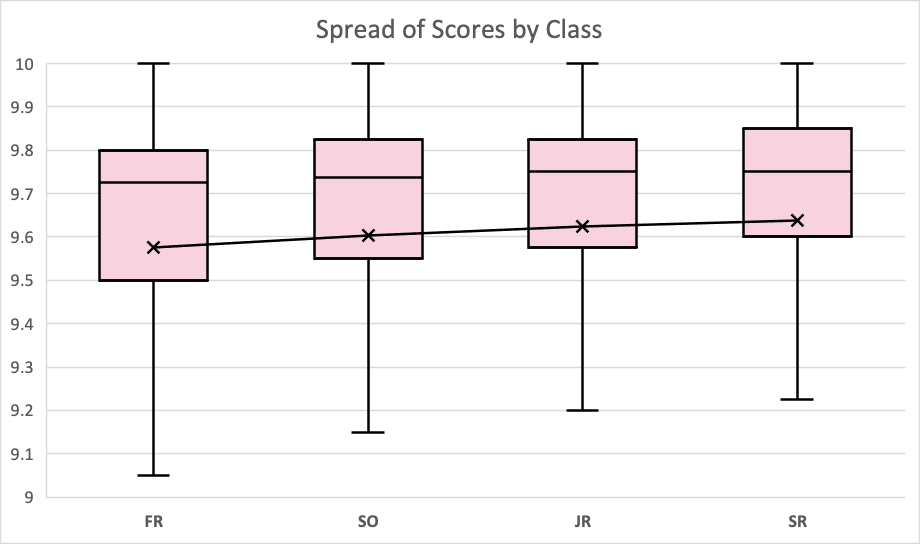
Most notably, the median score between the classes does not vary much, with all classes having a median score between 9.7 and 9.8. The mean score doesn’t vary much as well, with the mean scores for each class within a 0.5 point range. Freshmen tended to have a wider spread of scores throughout the decade, with a notably larger interquartile range (25th percentile score to the 75th percentile score) than the other classes. While the classes tended to have a similar 75th percentile score, the 25th percentile score tended to be lower in the underclassmen competitors over the decade, suggesting that underclassmen tended to reach the lower end of the score range more often than the upperclassmen.
Trends by Events Competed
Another scope useful for analyzing the decade’s changes in scoring is the number of events a gymnast competed. To make this analysis more meaningful, we included individual analyses for Division I and Power Five teams to make the choice to compete less events more meaningful (aka teams where the choice to compete all four events is meaningful). Power Five teams consist of teams within the SEC, Big 12, Big Ten and Pac-12 conferences.
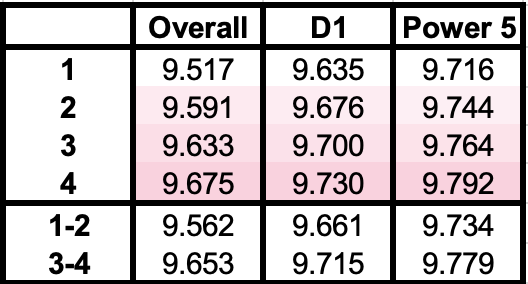
While the average scores differed based on the categorization of the team, all three individual analyses proved that gymnasts who competed more events generally scored higher.
Successful Event Combinations
| Events | Successful | Competed | Percentage |
|---|
Beyond the number of events competed, we were curious whether gymnasts who competed in certain combinations of events were more likely to excel than others. To this end, we looked at the number of times a gymnast scored a 9.9 or better on an event in a given year, as a percentage of the number of routines competed. A gymnast was then deemed "successful" on that event, in that year, if their percentage of 9.9-plus scores was at or above the 90th-percentile. The tables above show the percentage of successful gymnasts on each event, by event combination. Note that we limited this analysis to teams that counted no score lower than 9.8 on an event for at least 80% of meets in a year, so as to identify cases in which gymnasts actively chose to compete in specific events, rather than instances where teams were relying on gymnasts to step up and compete on an event due to a lack of depth.
One trend that immediately stood out to us when looking at changes over time was the sharp rise from 2013 to 2022 in the percentage of all-around gymnasts who were successful on vault, beam and floor. While all-around gymnasts were already among the most successful on these three events in 2013, with 17.1%, 19.1% and 19.1% of them being labeled as "successful" on vault, beam and floor, respectively, based on our methods, these percentages shot to 27.3%, 30.0% and 28.2% in 2022 — between 1.5 and 2 times as successful as the next most successful combination. Interestingly, this trend was not observed on bars; though the percentage of all-around gymnasts who saw success on the event similarly increased from 17.1% in 2013 to 23.6% in 2022, the percentage achieved by the next most successful combination, 20.0%, remained close behind.
In stark contrast to all-around gymnasts, single-event specialists tended to have lower rates of success, generally ranking in the bottom half of event combinations. Two notable exceptions to this trend were beam and floor specialists in 2021, with 17.5% and 13.1% of them being labeled as "successful," respectively — the third most successful event combinations on the events that year. With regards to two-event specialists, we were surprised to find that the most successful combination on vault was vault/bars, with vault/bars two-event specialists achieving the highest percentage of success in five of the 10 years studied, despite vault/floor being the more stereotypical two-event combination.
Discussion
The analyses we have presented throughout this four-part article, while not exhaustive, highlight some key insights about both enduring aspects of, as well as changes to, college gymnastics scoring in the last decade. Although we found some evidence that could account for the common perception of scores rising in recent years — most notably, that weeks in which at least 10% of routines scored a 9.9 or better have come earlier in the last two seasons than those prior and that underclassmen scores peaked in the most recent season — we also found instances of scoring becoming tighter, particularly on vault, following the downgrade of the Yurchenko full in 2016.
Moreover, we found that, while certain teams showed clear dominance both within conferences and across college gymnastics at large, competition could become tighter in the coming seasons for some conferences, particularly the SEC, following Oklahoma's move to the conference beginning in the 2026 season.
In terms of roster data, we were especially intrigued to find that athletes who regularly competed a larger number of events tended to perform better than one or two-event specialists. Additionally, we noted that dependence on, as well as individual success of, athletes who regularly competed on all four events also showed substantial growth over the last decade.
READ THIS NEXT: Data Deep Dive: Scoring Trends of the Last Decade – Part 3
Article by Dara Tan and Emma Hammerstrom
Like what you see? Consider donating to support our efforts throughout the year! [wpedon id="13158"]