Over the last two weeks, we examined broad changes in scoring over the last decade. For this week’s article, we dove deeper into our scoring data, in addition to information on conferences, with the goal of answering the following question: Have scoring changes affected gymnasts equally across the board?
We began our investigation into this question by looking at scoring trends by conference. For this, we looked at data for conferences that had been in existence for at least half of the decade of interest — we excluded the ECAC-III, GEC and WAC conferences. Since not all conferences have teams which regularly compete in the postseason, we limited our conference analyses to regular season meets, excluding conference championships. Event-level analyses included only rotations in which at least five scores were recorded and a meet for a team was only included in meet-level analyses if the team recorded at least five scores on all four events.
Across Conferences
Mean Scores by Conference
| Conf |
2013 | 2014 | 2015 | 2016 | 2017 | 2018 | 2019 | 2020 | 2021 | 2022 |
|---|---|---|---|---|---|---|---|---|---|---|
An important factor in analyzing how scores changed over the past decade was taking into account how scoring trended across conferences. In order to accomplish this, we compiled tables that looked at how overall team scores changed from 2013 to 2022 across conferences. Mean scores were used for these tables, with each value representative of the mean rotation total for a conference on an event in each respective season. Analyzing the rotation totals gives a more detailed picture of how scoring changes occurred on a team level, rather than just focusing on those changes on an individual level. To demonstrate these scoring changes, pink marks a decade low and green a decade high.
One of the most glaring takeaways from this analysis is that beam and floor scoring were consistently at their lowest in 2014 and their highest in the 2021 and 2022 seasons across conferences, but vault and uneven bars were more variable in their peaks. Vault rotation totals tended to dip in 2016, most likely responding to the devaluation of the Yurchenko full to a 9.95 start value. Uneven bars highs and lows had a wider variation between seasons, with the most general applicable trend being that the majority of lows occurred before 2016 and the majority of highs occurred in the 2022 season.
Percentage of 9.9+ Scores by Conference
| Conf |
2013 | 2014 | 2015 | 2016 | 2017 | 2018 | 2019 | 2020 | 2021 | 2022 |
|---|---|---|---|---|---|---|---|---|---|---|
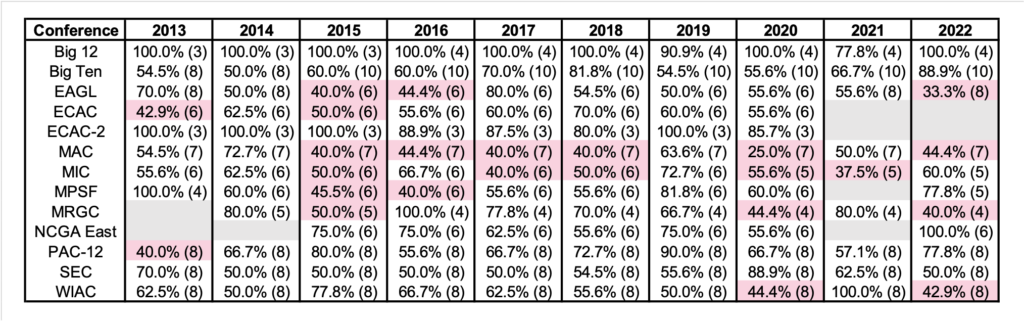
When looking at distribution of scores across conferences at an individual routine level, a good point of reference is looking at the percent of scores that were above 9.9 in each conference for each season. Tables were constructed again to demonstrate how the percentage of scores at or above 9.9 changed in each conference over the decade, both at an overall and an event level. Percentages were calculated by dividing the number of scores at or above the score of 9.9 by the total number of scores tallied in that conference for a singular season. The percentage of scores at 9.9 or above aims to show how dominant a conference was over the decade, with higher percentages signaling better performance from a conference compared to itself throughout the years or others in the same year. A pink shaded cell once again demonstrates a decade low, and a green shade is a decade high. Something to keep in mind is that not all conferences are built equally in terms of number of routines. It is more feasible for the Big 12, a four team conference, to produce a higher percentage of 9.9-plus scores than the Big Ten, a 10-team conference.
Looking at vault first, especially in the context of the devaluation of the Yurchenko full to a 9.95, every single conference (except the MAC) had a drop in percentage of scores above a 9.9 in the 2016 season. The MRGC conference was the most hard hit by the devaluation, dropping from 9.2% to a mere 1.7% after the start value was lowered. Vault also boasted the lowest overall percentages of 9.9-plus scores compared to the other three events, signaling that it may be harder to achieve a 9.9 on that event than the others. Percentages of 9.9-plus scores on bars and beam generally peaked in the 2022 season. The Big 12 was a notable outlier with consistent peaks in 2019 — a season that brought top five NQS scores for Denver and Oklahoma, as well as a trip to the NCAA national championships. Floor was overwhelmingly strong in 2022, with eight of 11 conferences having their highest percentage of 9.9-plus scores of the decade. The SEC had a whopping 40% of routines score over 9.9-plus in the 2022 season.
Percentage of 9.9+ NQS by Conference
| Conf |
2013 | 2014 | 2015 | 2016 | 2017 | 2018 | 2019 | 2020 | 2021 | 2022 |
|---|---|---|---|---|---|---|---|---|---|---|
However, a single 9.9 score may not be a predictable sign of strength within a conference. To take this analysis further, a focus was also put onto consistent 9.9-plus scores. We defined a consistent 9.9-plus score as a gymnast who held a 9.9 or above NQS on each event. We created tables with the percent of gymnasts with an NQS on a specific event above 9.9 and compared them across conferences and years. A caveat of this analysis is that the makeup of an NQS temporarily changed in response to the altered 2021 season, meaning an NQS in 2021 is made up of fewer scores than one from another season. Another caveat is that many conferences have never had a gymnast with an NQS above 9.9 on an event, limiting much of the analysis to the Power Five conferences.
Differing from just the plain analysis of 9.9 scores, it was not as common for conferences to reach scoring peaks in the 2022 season, especially on vault, where peaks generally occurred before the devaluation of the Yurchenko full. The SEC’s strength in the 2022 season shone through in this analysis, boasting the largest percentages of gymnasts holding an NQS above 9.9 on each event.
Within Conferences
Aside from comparing scoring trends across conferences, we were also curious how scoring trends within conferences changed, if at all. This portion of our analysis was motivated by the following question: How plausible does the path to the top of the conference seem for gymnasts and teams in each conference?
To quantify this on a team-level, we looked at how teams ranked against others in the conference for each week in our data. Ignoring years in which a conference had fewer than three active teams, as well as weeks in which fewer than two teams in a conference had a meet, we identified the highest score achieved by each team in each week. Using these weekly high scores, we then ranked teams within their conferences and calculated two statistics:
- Win percentage, calculated for each team, each year: the percentage of weeks in our data that a team had the top-ranked weekly high score.
- Gap size, calculated for each conference, each week: the difference between the first and second-ranked high scores.
The table above shows the highest win percentage achieved by a team in a conference in a given year. At first glance, we noticed that the highest win percentage was 100% for the Big 12 in all but two years, indicating that in almost every season of the past decade, the conference was heavily dominated by a single team. Also significant were the high percentages achieved on occasion in the Big Ten, Pac-12 and SEC, with highs of 88.9% in 2022, 90.0% in 2019 and 88.9% in 2020, respectively. While these percentages were neither as high as, nor observed as frequently as in the Big 12, they were noteworthy because they were achieved in conferences with more teams — at least double that of the Big 12; whereas evenly-matched teams in a conference the size of the Big 12 might have been expected to win around 33% of the time from 2013 to 2015 or around 25% of the time starting in 2016, evenly matched teams in larger conferences of eight to 10 teams would be expected to win only about 10 to 13% of the time, so the discrepancies between the highs achieved in the Big Ten, Pac-12 and SEC as compared to a similarly sized, evenly matched conference drew our attention.
To factor varying conference sizes into our analysis, we ran 100 simulations of 10-week seasons for conferences with different numbers of teams to determine what top win percentages would be reasonable if teams were evenly matched. Pink cells in the table above contain win percentages that fell within two standard deviations of the mean in our simulations; these were percentages that could plausibly be achieved in evenly matched conferences. Of the 13 conferences studied, only two, MAC and MIC, had pink cells for at least five of the 10 years.
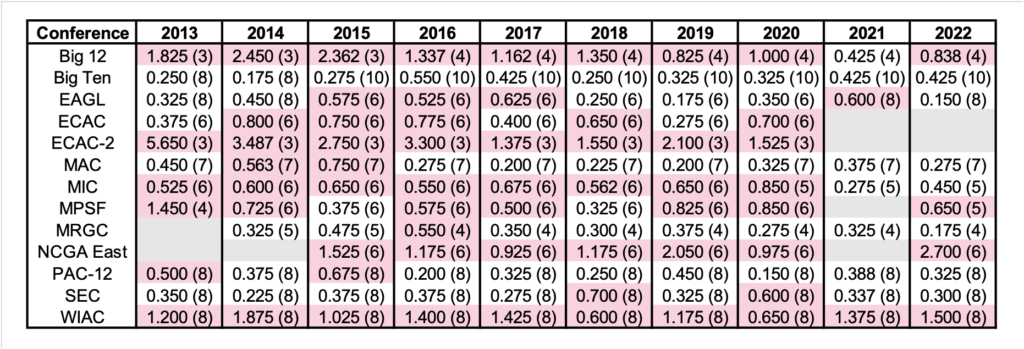
Aside from the highest win percentage, we also examined the median gap size in a conference, in a given year. In the table above, cells in pink correspond to median gap sizes of 0.5; these cells indicate years in which the difference between the first and second-ranked weekly highest scores was equal to or greater than the deduction for a fall in at least half of the weeks.
We note that all but one cell is highlighted in pink for the Big 12, bolstering our earlier conclusion that the conference was heavily dominated by a single team in every season of the last decade. On the flip side, the Big Ten has no pink cells, and the Pac-12 and SEC only have two pink cells each. As such, these conferences might have been more competitive than the previous table, when viewed in isolation, would suggest — although there were years in which these conferences had clear front-runners as indicated by the win percentages shown earlier, the next-best teams were often close behind, poised to take advantage of an unfortunate fall.
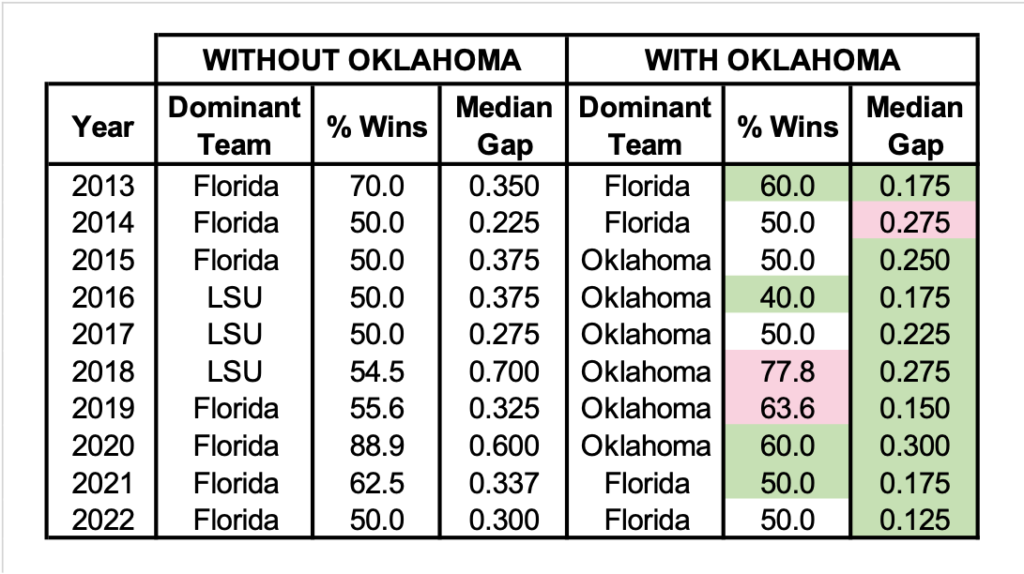
In analyzing the level of competition among teams in the same conference, we questioned how things might have played out had Oklahoma competed in the SEC over the past decade, as it is slated to beginning in the 2026 season. To shed light on this question, we repeated our earlier analyses for the SEC and compared the results when excluding, as compared to including, Oklahoma. Cells in green correspond to a decrease in either the highest win percentage or the median gap size, both of which suggest the inclusion of Oklahoma might have made the competition among SEC teams more heated. Conversely, cells in pink show changes in metrics that suggest the inclusion of Oklahoma might have reduced the level of parity in the conference.
Looking at the results without factoring Oklahoma into the picture, we were not surprised to find Florida and LSU as the dominant teams, with Florida edging LSU out in seven of the 10 years. When we included Oklahoma in the analysis, the extent of Florida’s dominance was reduced, but we were intrigued to see that the split between the years in which Oklahoma, rather than Florida, would have dominated was relatively even — Oklahoma would have dominated in six years while Florida would have dominated in four, including the most recent season. Focusing specifically on the win percentages and gap sizes, we found that the inclusion of Oklahoma would have made competition within the SEC more heated overall, with decreases in the gap size in all but one year being especially compelling.
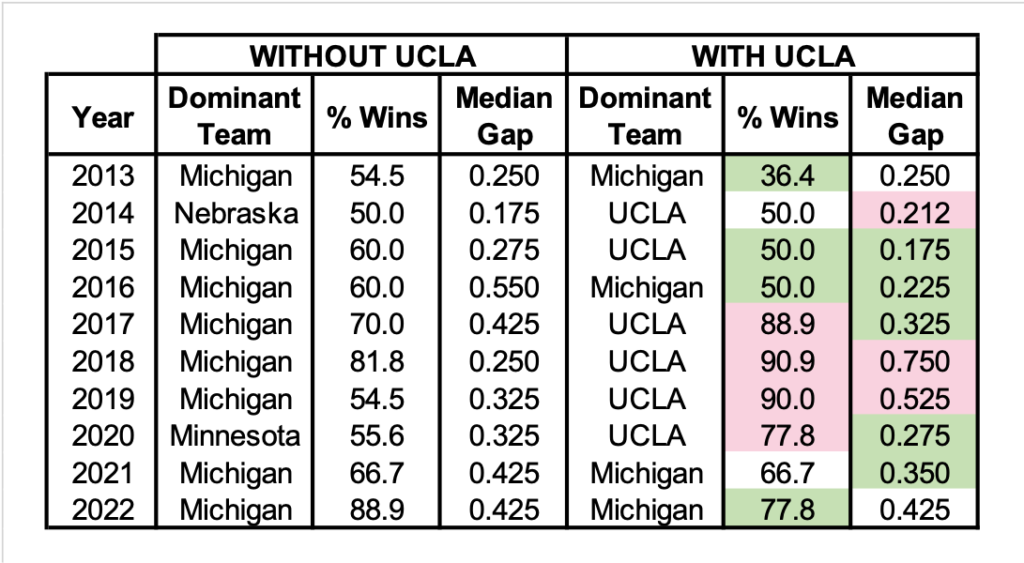
In a similar vein, following UCLA’s recent announcement that it was joining the Big Ten starting in the 2025 season, we repeated our analyses for the Big Ten and compared the results when excluding, as compared to including, UCLA. However, unlike with Oklahoma’s impending move to the SEC, the results we obtained were rather mixed. While UCLA’s presence in the Big Ten would have made intra-conference competition more heated in some years, for instance by reducing the highest win percentage from 60.0% to 50.0% and the median gap size by 0.1 in 2015, their presence would have had the opposite effect in 2019, where the highest win percentage would have shot up from 54.5% to 90.0% and the median gap would have been two tenths larger. Given these conflicting effects, it will be interesting to see how UCLA’s presence alters scores in the Big Ten, starting two years from now.
Median 90th-percentile Scores by Conference
| Conf |
2013 | 2014 | 2015 | 2016 | 2017 | 2018 | 2019 | 2020 | 2021 | 2022 |
|---|---|---|---|---|---|---|---|---|---|---|
Pivoting to our gymnast-level analyses, we first examined the level of competitiveness within each conference by looking at the 90th-percentile score on each event, or the score which ranked above 90% of scores on the given event. We determined these scores on a weekly basis for each conference, then obtained the median for each conference in each year, as shown in the tables above. Cells in green and pink indicate the highest and lowest medians for each conference across the decade of interest.
From the tables, we observed that the majority of green cells occurred in the second half of the decade on bars, beam and floor. In other words, the median 90th-percentile score on these events has been higher in more recent years; gymnasts have needed to achieve increasingly high scores to be among the best in their respective conferences. This was particularly true on beam, where green cells showing scores of at least 9.618 were observed for every conference in 2022. The one exception to this trend was vault, where about half of the green cells occurred in the first half of the decade, prior to the downgrade of the Yurchenko full in 2016.
Percentage of Gymnasts by Conference
| Conf |
2013 | 2014 | 2015 | 2016 | 2017 | 2018 | 2019 | 2020 | 2021 | 2022 |
|---|---|---|---|---|---|---|---|---|---|---|
Having looked at the scores needed to stand out on each event in each conference, we wondered if scores at or above the 90th-percentile mark were achievable for the majority of gymnasts in a conference, or if such scores were reserved for a select few. To investigate this, we calculated the percentage of gymnasts in each conference who achieved the median 90th-percentile score at least once, on each event, in each year, as shown in the tables above. Green and pink cells represent years with the highest and lowest percentages respectively.
On vault, we note that green cells were primarily observed in the second half of the decade, after the downgrade of the Yurchenko full, suggesting that the downgrade increased the parity on the event by enabling a larger percentage of gymnasts to achieve the highest vault scores in their conferences. Trends on the other events were less distinct, but we found it noteworthy that pink cells were observed for six of 13 conferences, including the PAC-12 and SEC, in the last two years alone on floor.
Discussion
Following a consistent theme throughout our analysis, 2021 and 2022 had overwhelmingly been a deviation from normal scoring trends within conferences. The majority of the scoring peaks within and across conferences occurred in those seasons, especially on beam and floor. Analyzing scoring changes across conferences highlighted the broad effects of vault start value changes. Many of the scoring peaks on vault occurred pre-2016 when the Yurchenko full was devalued from a 10.0 start to a 9.95. This disproportionately affected smaller conferences where vault lineups were primarily made up of Yurchenko fulls rather than more difficult vaults. Additionally, while our analysis on the impact UCLA’s presence in the Big Ten could have had produced inconclusive results, our parallel analysis on the impact of Oklahoma’s presence suggests competition within the SEC could get more heated soon, starting in the 2026 season.
Coming Up Next
Stay tuned for next week, where we’ll wrap up this Data Deep Dive by looking at our scoring data, in conjunction with team rosters, to answer questions about how scoring changes by class standing and events competed.
READ THIS NEXT: Data Deep Dive: Scoring Trends of the Last Decade – Part 2
Article by Dara Tan and Emma Hammerstrom
Like what you see? Consider donating to support our efforts throughout the year!