
In other sports, the label of “most valued player”—or MVP for short—is often bestowed upon the most outstanding athletes who have made substantial contributions to their teams. In the context of college gymnastics, there are multiple criteria, based on different notions of “value”, by which MVPs can be selected—for example, hit rate if consistency is of utmost importance, or the number of 9.9-plus scores if scoring potential is valued more highly.
This Data Deep Dive explores two ways in which MVPs can be determined, and how this past season played out for different teams and gymnasts using that lens.
Methodology
On Road To Nationals, the MVP statistic is calculated as the sum of the scores received by a gymnast on a given event across the season. Since the sum is affected by a gymnast’s high and low scores alike, this has the benefit of capturing both a gymnast’s level of consistency and their potential for impressive scores. Additionally, the “Total” column, which sums the scores received across all four events, can offer some insight into a gymnast’s ability to contribute to multiple lineups.
For the first calculation in this Data Deep Dive, the results of which we will refer to as the “contribution points”, we adopted the MVP statistic from Road To Nationals, but made two adjustments to better reflect the size of a gymnast’s numerical contribution to their team’s score.
First, only scores that contributed to the team total at the respective meets were included. Second, in the event of a tie, points were divided among the tying gymnasts. For instance, if two gymnasts scored a 9.850 to tie for the fifth highest score in the lineup, we added 9.850/2 = 4.925 to each gymnast’s contribution points tally.
For the second calculation, we looked at the size of a gymnast’s numerical contribution to their team’s score relative to their team’s available alternatives.
For each meet and event on which a team put up a lineup of six gymnasts, we divided the difference between the highest and lowest scores in the lineup as follows: each of the top five gymnasts was allocated one fifth of the difference between the lowest and second-lowest scores, each of the top four gymnasts was allocated one quarter of the difference between the second and third-lowest scores, and so on, with the final calculation for a gymnast being the sum of all the allocated differences.
While the method underlying this calculation may sound more abstract than the first, the question it aims to answer is fairly intuitive: how much would it cost a team, in terms of scores, to replace a given gymnast? To reflect this question, we will refer to the result of this calculation as the “replacement cost”.
Results
Distributions Within Teams
Using the calculations above, we conducted two sets of analyses. To start, we looked at how the relative contributions of gymnasts within a team—as determined by gymnasts’ contribution points relative to their team’s total counting scores throughout the season—varied across teams.
In the charts of cumulative percentages of contribution points below, each line represents a team. Every team is included in each chart, but most teams are shown in gray, while a handful of teams are highlighted in shades of red or green. A line approximating the median is also shown in blue.
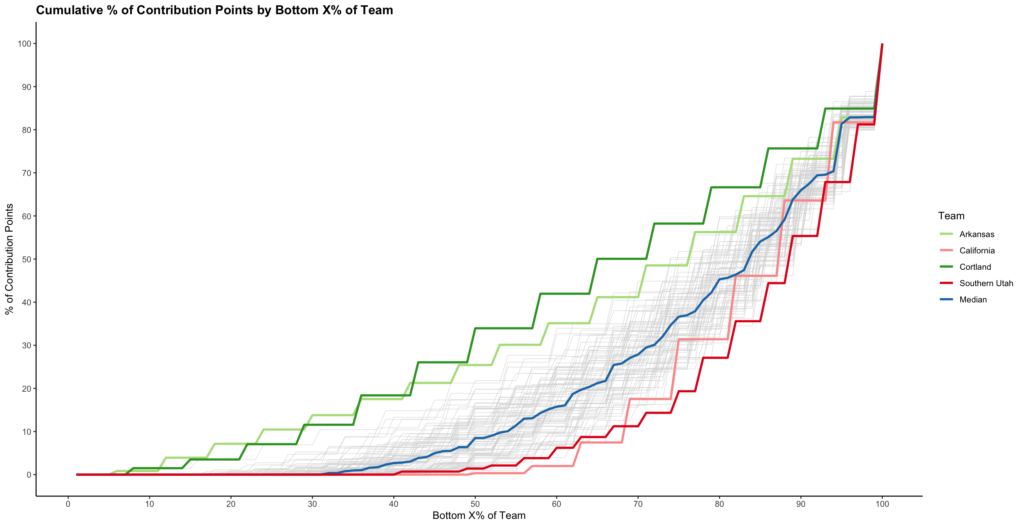
In the chart above, the horizontal axis, Bottom X% of Team, is calculated as a gymnast’s rank within their team based on their contribution points, relative to the number of gymnasts on their team’s roster. For example, if a gymnast’s contribution points tally was the third-lowest on their team of 30, they would be in the bottom 3/30 = 10% of their team.
As a result of this definition and likening the lines above to staircases, we would expect the height of each step to be higher on the left of the chart than on the right. Based on the blue median line, we would also expect to see non-zero contributions from about 70% of each team, with the top 10% of contributors notching about 35% of the team’s counting scores, on average.
The extent of the step height difference, however, can and, as we observe above, does vary across teams. Cortland and Arkansas, highlighted in green above, have relatively smaller differences in step heights, suggesting that contribution points were distributed more evenly across the team.
In contrast, looking at the red lines corresponding to Southern Utah and California, we observe larger differences between the shortest non-zero and the tallest step heights, as well as a longer than average zero-height step stretching to nearly the 40% mark on the horizontal axis for Southern Utah, or nearly the 50% mark for California. This indicates a more uneven distribution of contribution points across both of these teams’ rosters, with nearly 40% and 50% of the rostered gymnasts not contributing any counting scores.
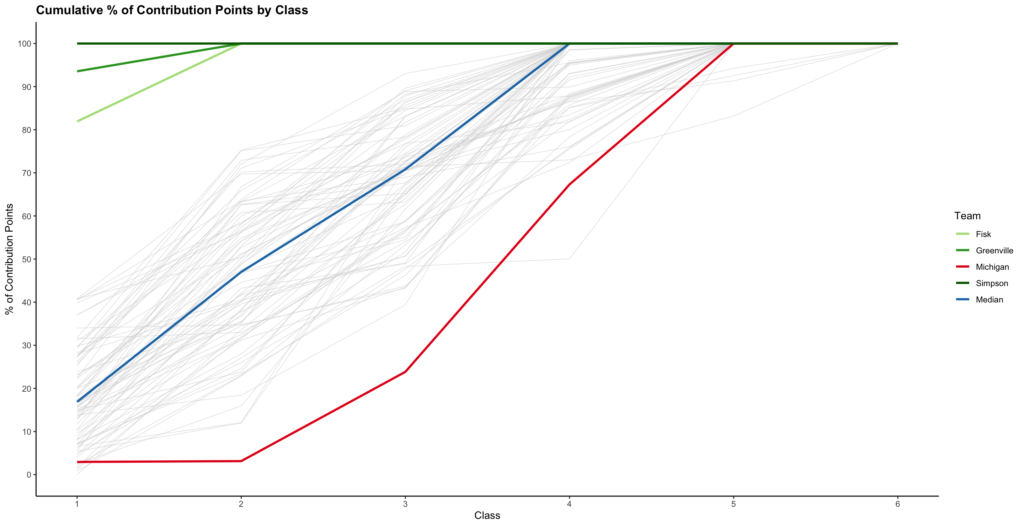
In the chart above, the horizontal axis indicates a gymnast’s class, with one representing freshmen, while five and six include fifth years, sixth years and graduate students. Simpson, Greenville and Fisk, shown in green above, relied heavily (or entirely, in the case of Simpson), on freshmen in their inaugural seasons, who scored over 80% of contribution points.
In contrast, almost none of Michigan’s counting scores were earned by underclassmen, with over 75% of all contribution points attributable to seniors and fifth years.
The variations in contributions by classes are further underscored by the differences in the average class of a team, weighted by contribution percentage. The five lowest and the five highest weighted averages are shown in the table below:
| Team | Weighted Average of Class |
| Simpson | 1.00 |
| Greenville | 1.06 |
| Fisk | 1.18 |
| Alaska | 2.08 |
| UW-Stout | 2.12 |
| Illinois | 3.44 |
| Iowa State | 3.53 |
| Denver | 3.54 |
| Southern Utah | 3.69 |
| Michigan | 4.03 |
As previewed by the chart above, Simpson, Greenville and Fisk had the lowest weighted averages, each close to one, while Michigan had the highest weighted average at 4.03—the only weighted average to exceed four. Southern Utah, which benefited from strong contributions by its fifth years, had the second-highest weighted average at 3.69.
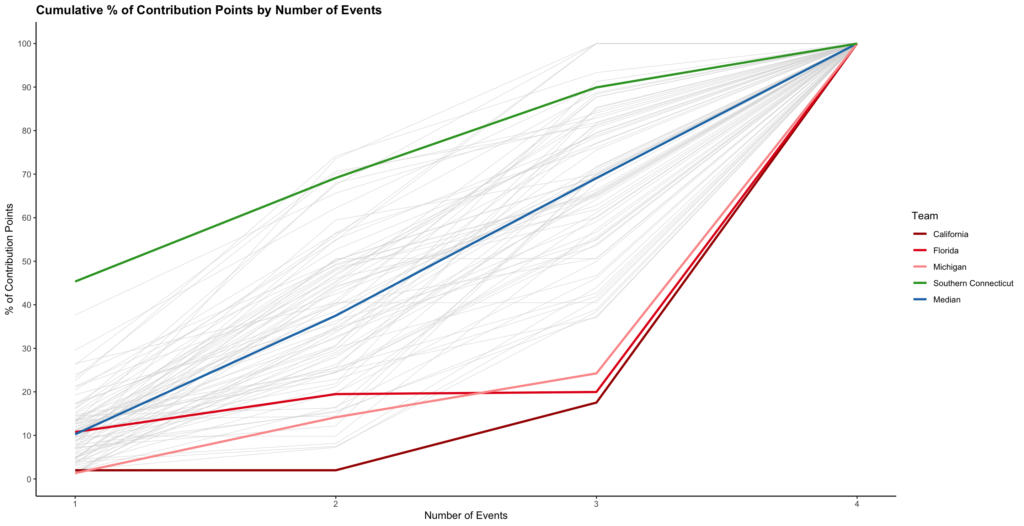
In the chart above, the horizontal axis indicates the number of events on which a gymnast competed at least once during the season. Southern Connecticut, highlighted in green above, stood out from other teams with about 45% of contribution points being earned by one-event specialists—the most of any team.
On the flip side, as shown by the red lines, California, Florida and Michigan leaned heavily on all-arounders, who contributed upwards of 75% of each team’s counting scores.
The variations in contributions by classes are further underscored by the differences in the average number of events competed by a team’s gymnasts, weighted by contribution percentage. The five lowest and the five highest weighted averages are shown in the table below:
| Team | Weighted Average of Events |
| Southern Connecticut | 1.96 |
| Towson | 2.10 |
| West Chester | 2.13 |
| Brockport | 2.16 |
| Gustavus Adolphus | 2.18 |
| Auburn | 3.50 |
| Florida | 3.50 |
| Penn State | 3.50 |
| Michigan | 3.60 |
| California | 3.78 |
As previewed by the chart above, owing to its high percentage of contributions by one-event specialists, Southern Connecticut had the lowest weighted average at 1.96—the only weighted average under two. Meanwhile, Florida, Michigan and California had high weighted averages of 3.50 or higher. Auburn and Penn State, teams on which all-arounders contributed about 60% of counting scores, rounded out the five highest weighted averages.
Individual MVPs
Having examined the distributions of contribution points within teams, we refocused our attention on the original question—that of MVPs. To identify the most valuable individuals across teams, we looked at three summary statistics pertaining to both the contribution points and the replacement cost:
- Total: We tallied each gymnast’s contribution points and replacement cost throughout the season on each event. We also calculated a total across all events.
- Average: For each gymnast on each of the four events, we divided the total statistic described above by the number of meets at which (a) the gymnast competed on the event and (b) the gymnast’s team put up a lineup of at least five gymnasts in the case of contribution points, or six in the case of replacement cost.
- Percentage: On (a) each of the four events and (b) across all events, for each gymnast, we divided the total statistic described above for that gymnast by the sum of the total statistic across all gymnasts on their team.
Individual MVPs
| Rank | Vault | Bars | Beam | Floor | All |
|---|
The table above shows the top 10 gymnasts on each event and across all events, using the contribution points calculation method and the total summary statistic, but different options can be selected from the dropdown lists to view the results under different method-statistic combinations.
Looking at the results for the contribution points calculation method, we notice that Haleigh Bryant, who competed in the all-around in all 16 meets this season, is not only the sole gymnast to appear in all five columns of the total statistic, but also sits at the top of the rankings in each case. When turning to the average statistic, we begin to see gymnasts such as Olivia Trautman and Sunisa Lee, whose number of meets were limited due to injury, but who made each opportunity count.
Pivoting to the percentage statistic of the contribution points method, and the total and average statistics of the replacement cost method, we find that most of the gymnasts in the top 10 compete for lower-ranked programs.
Though they may not consistently be notching scores that can contend with Olympians, or former elites and Level 10 standouts, these results nonetheless highlight the importance of these gymnasts' scores to their teams. A prime example is Morgan Price, who claimed spots in the top 10 on all four events, including the top spot on vault, using the average statistic of the replacement cost method.
Finally, when examining the results of the percentage statistic of the contribution points method, we observe gymnasts from a variety of teams, who each account for almost or upwards of 30% of their team's replacement cost on an individual event, or upwards of 20% across all events. Moreover, we note that these percentages are highest on vault, potentially due to start value differences.
Discussion
In conclusion, the results above provide some insight about how the contributions of individuals or groups of gymnasts within a team vary across teams, as well as which gymnasts can be said to have been the most valuable to their teams this past season based on different methods and statistics.
However, it is important to note that these analyses are based purely on scores, thus can only capture a gymnast's numerical value to their team. Unquantifiable qualities such as leadership and mental toughness would not have factored into these analyses, but may nevertheless make a gymnast a valuable asset to their team.
READ THIS NEXT: Data Deep Dive: Is There a Winning Formula at NCAA Championships?
Article by Dara Tan
Like what you see? Consider donating to support our efforts throughout the year! [wpedon id="13158"]


I think scores are part of being an MVP but I think a nod to gymnasts like Amelie Morgan who are lead-offs on apparatus where falls can make a big difference would be good to see.
She’s consistently 9.8ish but most importantly has hit every routine in 2 seasons and whilst those scores often end up dropped or are at the lower end overall her team mates are left knowing they don’t have to make up for an early error.
This method is ridiculous. Case and point Maile O’Keefe of Utah. Number 1 on beam ALL season. Multiple 10 and national winner yet look where you have placed her. What’s EXTREMELY annoying and frustrating to us who are fans of the sport is that one’s like you who seem th have the voice will choose and focus on a few gymnasts and never consider the others.
While not trying to say the others mentioned lack or are less than in talent they are not always the ones at the top. If you are going to put info out there at least give credit where it’s due. There are many talented gymnasts out there just as there are other teams besides Oklahoma that have proven themselves and have a much better attitude.