
As gymnastics fans we hear all the time that having a full lineup of 10.0 start value vaults gives a team a 0.25 scoring advantage over a lineup of Yurchenko fulls, how ending on floor at home gives the home team a scoring advantage, or how beam is the make or break event in a meet. There’s certainly truth to those statements, but is one particular event really the most important for a team’s success? Does having a certain event as a strength automatically give a team an advantage in the rankings?
To look at this, we started by averaging together every Division I team’s event NQS and event average to find the overall trend. From this data, floor was deemed the highest scoring event overall by both metrics. Vault was the lowest scoring by NQS, while bars and beam were both lower based on average, possibly due to increased opportunity for error that is more easily ignored when lower scores are dropped for NQS.
| Vault | Bars | Beam | Floor | |
| NQS | 48.9831 | 49.0138 | 49.0351 | 49.1748 |
| Average | 48.8579 | 48.7970 | 48.8077 | 49.0125 |
These trends lead to a lot of questions when it comes to a team’s strategy for success. Is going big on floor, where the scores are consistently higher, the most lucrative strategy? Is trying to gain ground on vault through a full lineup of 10.0 start values, immaculately clean simpler vaults, or maybe both a more proven approach? Maybe banking on high risk, high reward events like bars and beam can work out as long as the lineups can keep it together in the most pressure-packed environments.
When looking at which event had the highest ranking for the teams in the national final, floor seems to be slightly favored, with vault not being a top strength for any team in the top four. In fact, Oklahoma won the national title last season ranked number one on every event except vault where it was ranked number three.
| Team | Vault | Bars | Beam | Floor |
| 1. Oklahoma | 3 | 1 | 1 | 1 |
| 2. UCLA | 7 | 8 | 4 | 1 |
| 3. Missouri | 11 | 4 | 11 | 4 |
| 4. Utah | 6 | 4 | 3 | 6 |
However, when we expand the data to include teams from the national semifinals, a different pattern emerges. Vault is the top-ranking event for every team that finished the season ranked fifth through eighth. There could be a lot of explanations for this phenomenon. Focusing heavily on vault just may simply not be as advantageous because a team can’t make up enough tenths to compete with the higher scoring events of other top teams. Perhaps vault was judged harsher at nationals than these teams are used to, so they weren’t able to build off of the event like usual. Maybe it’s simply a coincidence, and all the teams with the same strengths just happened to underperform on the day that decides the final rankings.
| Team | Vault | Bars | Beam | Floor |
| 5. LSU | 1 | 2 | 5 | 3 |
| 6. Michigan State | 4 | 7 | 13 | 13 |
| 7. Florida | 2 | 3 | 2 | 5 |
| 8. Alabama | 7 | 12 | 17 | 8 |
Event rankings aren’t the only aspect to consider though. After all, rankings are derived from comparing scores. Based on NQS and average, floor is the highest scoring event for most of the teams that made nationals, regardless of what event was ranked highest.
| Team | NQS | Average | ||||||
| VT | UB | BB | FX | VT | UB | BB | FX | |
| 1. Oklahoma | 49.475 | 49.6 | 49.565 | 49.615 | 49.415 | 49.513 | 49.46 | 49.519 |
| 2. UCLA | 49.305 | 49.425 | 49.535 | 49.615 | 49.213 | 49.269 | 49.385 | 49.531 |
| 3. Missouri | 49.285 | 49.47 | 49.37 | 49.575 | 49.15 | 49.367 | 49.254 | 49.458 |
| 4. Utah | 49.325 | 49.47 | 49.54 | 49.525 | 49.252 | 49.4 | 49.344 | 49.394 |
| 5. LSU | 49.54 | 49.535 | 49.495 | 49.605 | 49.444 | 49.429 | 49.392 | 49.465 |
| 6. Michigan State | 49.46 | 49.44 | 49.325 | 49.42 | 49.371 | 49.315 | 49.2 | 49.323 |
| 7. Florida | 49.505 | 49.53 | 49.555 | 49.545 | 49.441 | 49.416 | 49.295 | 49.42 |
| 8. Alabama | 49.305 | 49.35 | 49.3 | 49.505 | 49.208 | 49.279 | 49.119 | 49.329 |
When the analysis is expanded to include all teams that qualified to regionals that trend remains. The graph below shows the number of teams ranked in the top 36 that had each event as its best ranking, NQS, and average. Floor was the highest scoring event for the season overall and for the majority of teams. The distribution of best event by ranking showed no significant trend though.
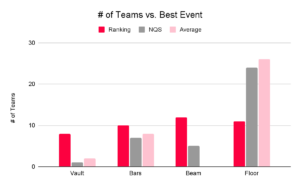
Based on this analysis, it seems that there isn’t one specific event that reliably leads to a successful season. Although floor is the highest scoring event, when it’s the highest score for almost every team it doesn’t do much to set a team apart unless you are the absolute best in the case of Oklahoma and UCLA. When looking at the range between the highest and lowest floor averages amongst the top 36 teams, there’s only a 0.673 difference, and that range decreases to only 0.607 when you remove Oklahoma and UCLA from the analysis. The other events have a range closer to 0.85-0.95 which leaves a bit more room for a team to set itself apart even if the events are lower scoring. However, being able to maintain higher scores on a low-scoring event where most other teams would’ve lost ground isn’t a proven strategy either. No team managed to make the national final that had vault as its best event, but it seemed to be a worthy enough approach to make the national semifinals, so maybe there’s some legitimacy to that strategy.
A lot of work goes into crafting rosters and lineups. Trying to strike the perfect balance between risk and reward is a big aspect of a coach’s job. Strategies change from year to year as athletes graduate and as rules change, and it’s clear from this analysis that there is no single strong event that matters more than the others. For teams like Oklahoma, being the best on every event in order to win the national title is a reasonable goal. They have the trophies to prove it, but not every team can have that pedigree. Some may choose to focus more on one event that its roster is strongest at, or focus on a full lineup of 10.0 start value vaults in hopes that the difficulty bump will lead to higher scores. If there truly was one event that mattered most, where higher scores guaranteed a higher ranking overall, the sport would likely lose a bit of its unpredictability and excitement.
READ THIS NEXT: Data Deep Dive: Level 10 Scoring Trends
Article by Mariah Dawson

It seems this graph is missing. Just letting someone know in case they forgot to add it, or so they can remove this sentence if there isn’t a graph. Love your website and the work y’all do!
“The graph below shows the number of teams ranked in the top 36 that had each event as its best ranking, NQS, and average. “
Why is a team, in more recent articles, referred to as “it” and not “they”? It seems impersonal in that they are people, yes?
We have always referred to teams as “it” because the word team or the school name is singular. Referring to teams as “they” is British English. Seeing that we are based in the U.S., we use American English as our guideline.