
As the NCAA season wrapped up last weekend, level 10 gymnasts around the country competed at regionals, hoping to qualify for nationals—one of the biggest stages many will compete on before entering the college ranks. For some, this is the beginning of their level 10 careers, but for many others, these are the final competitions before college.
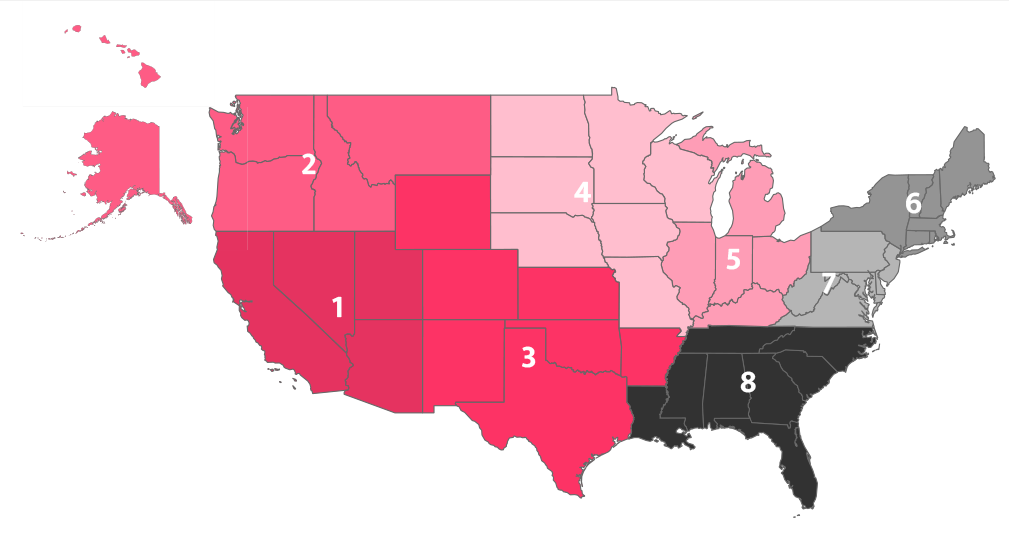
Unlike regionals at the college level—a combination of seeds and geographic placement to the host—the USA Gymnastics regional competitions are truly geographic, with each state assigned to one of eight regions. With this format, some regions present stronger competition than others. Rather than looking at level 10 success, though, we sought out to discover how gymnasts from each region perform at the college level, using data compiled from the last five college seasons (2018 to 2022).
Before getting into the specifics, here’s a brief overview of the regions. Note that we categorized gymnasts into regions based on the hometown listed on the Road To Nationals roster, and all following analysis is based on that categorization.
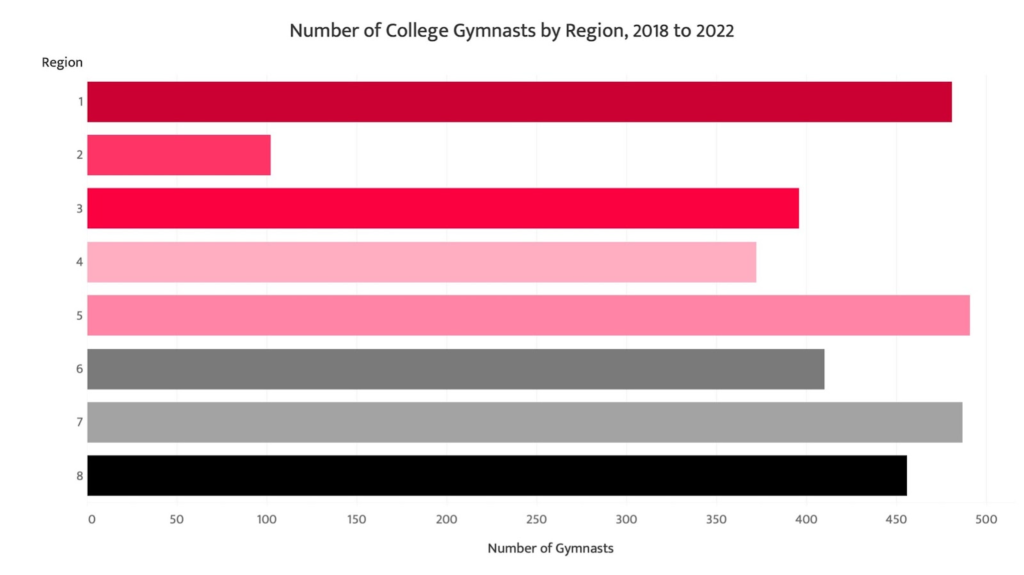
Of the rostered college gymnasts over the past five years, Region 1, Region 5, and Region 7 have seen the most gymnasts make a collegiate roster, each producing a similar number of college gymnasts. Region 3, Region 4, Region 6, and Region 8 are in the middle of the pack, with Region 2 lagging substantially behind.
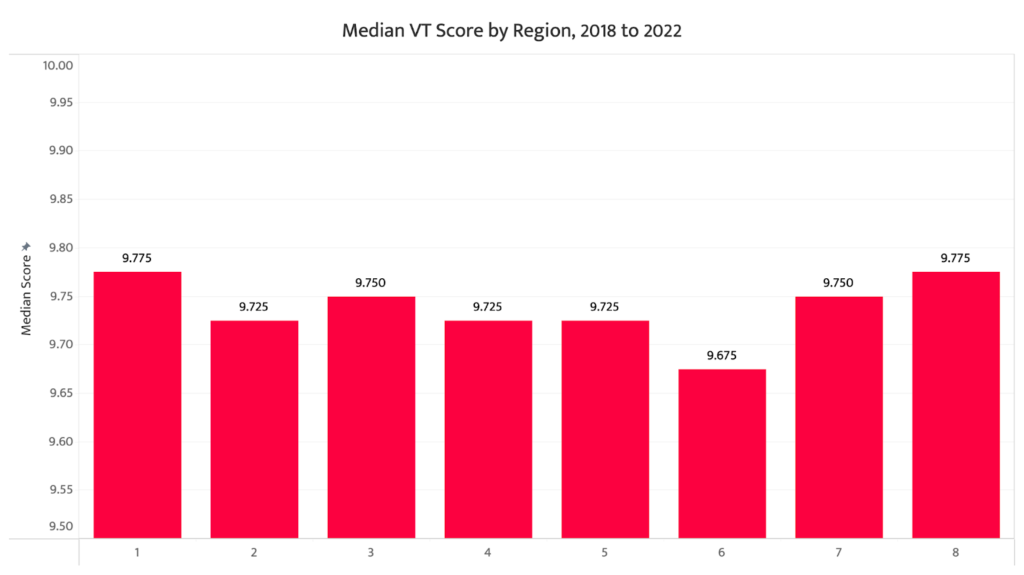
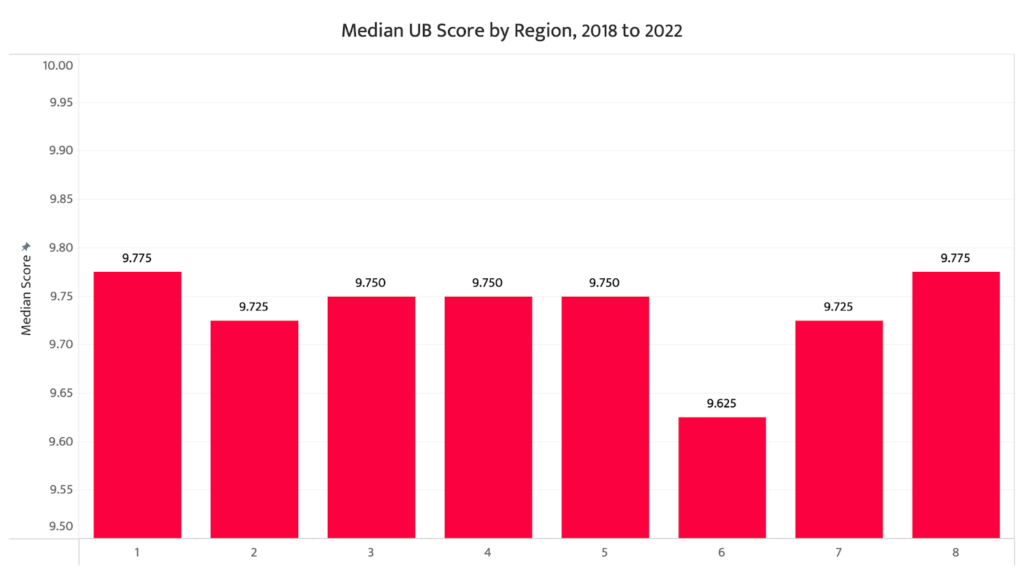
On the numbers side, we broke the scores down by event using the median rather than the average to lessen the effect of outliers and lower scores such as falls. This means 50% of the scores recorded from the corresponding region were higher, and 50% were lower than the score shown.
There was a mere tenth difference on vault between the highest median score, Region 1 and Region 7 at 9.775, and the lowest, Region 6’s 9.675.
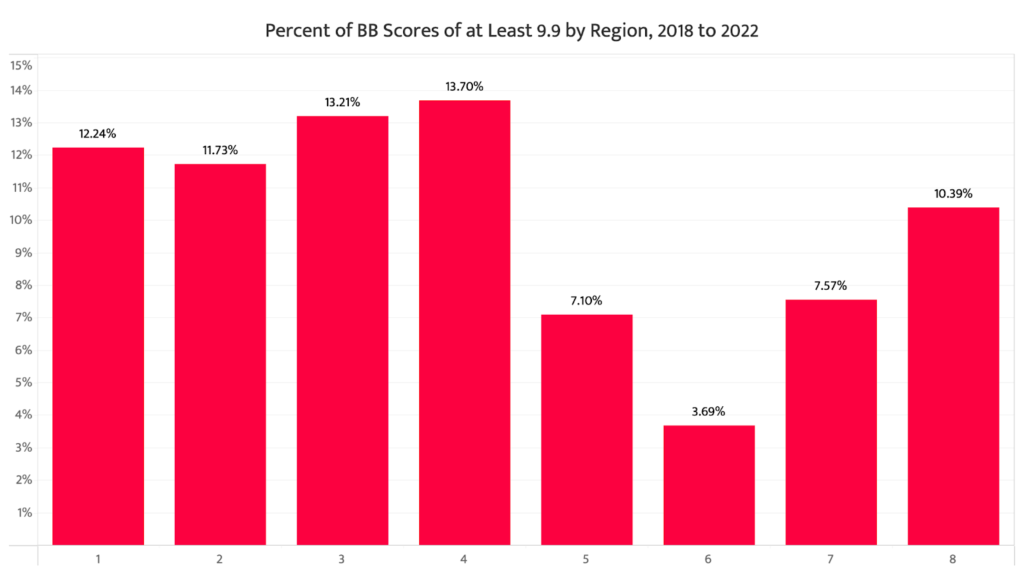
Bars painted a similar picture, with Region 1 and Region 8 leading the way. Region 4 and Region 5, among others, had median scores 0.025 lower, and Region 6’s median score was lower, too.
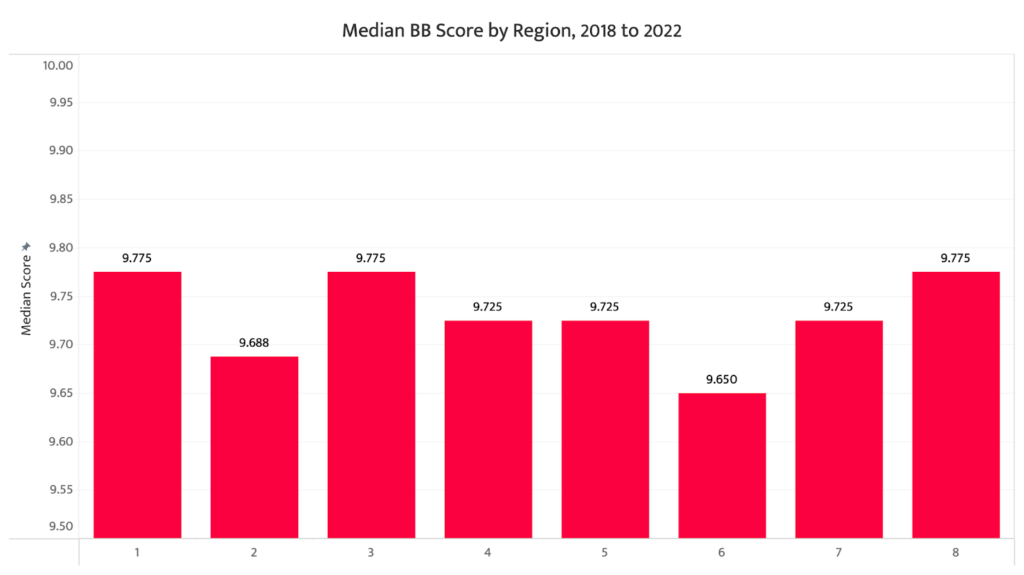
On beam, Region 3 joined Region 1 and Region 8 with a median score of 9.775.
Floor shows more parity and is the only event to reach a median score of 9.800 in some regions, though Region 6 is still slightly lower.

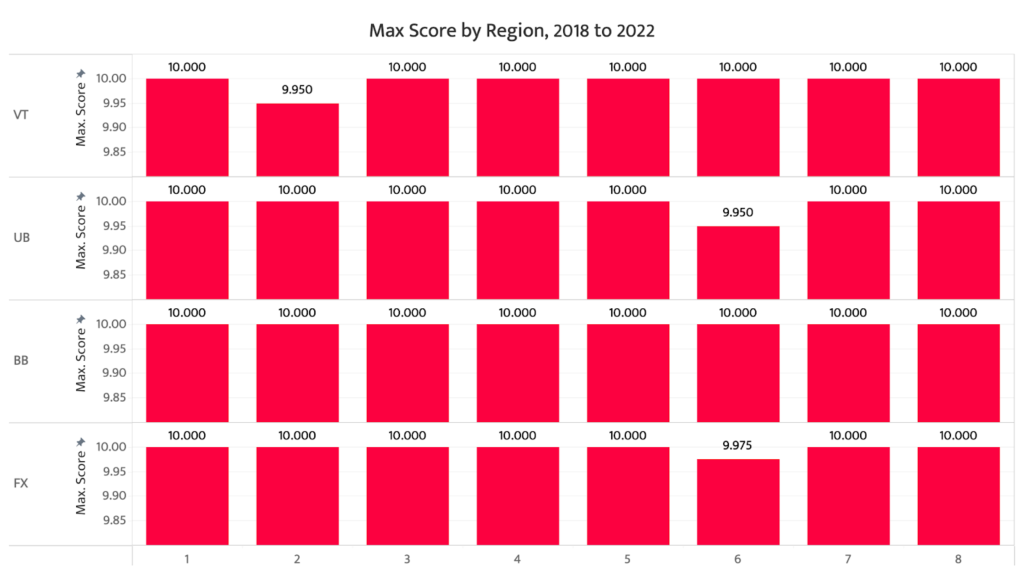
Shifting to the maximum score, it’s not super interesting, as it’s a 10 in most cases. What’s more interesting is the ones that aren’t 10—Region 2 vault (9.950), Region 6 bars (9.950), and Region 6 floor (9.975). While beam is often seen as a make-or-break event, it is the only event that topped out at the max in every region.
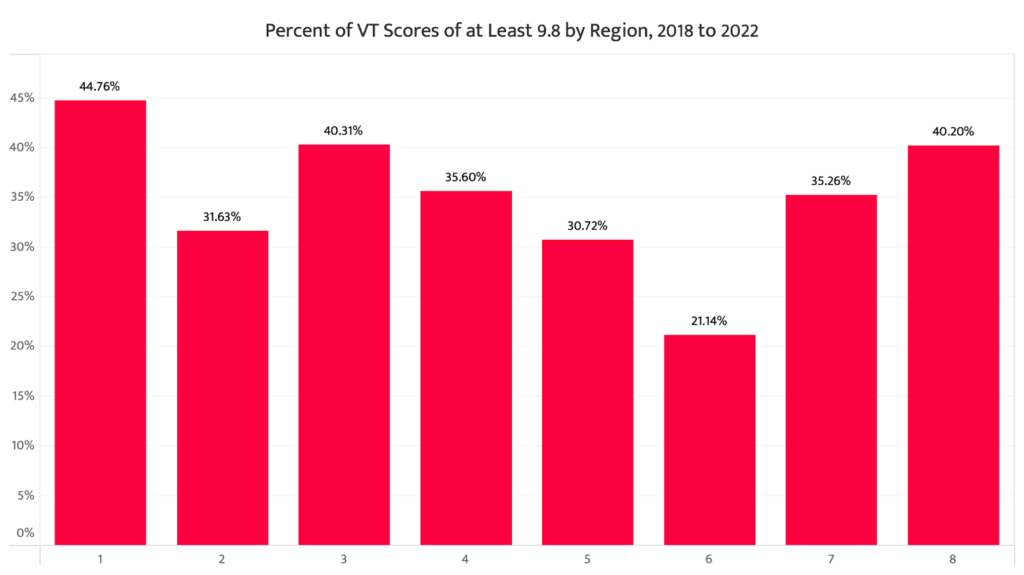
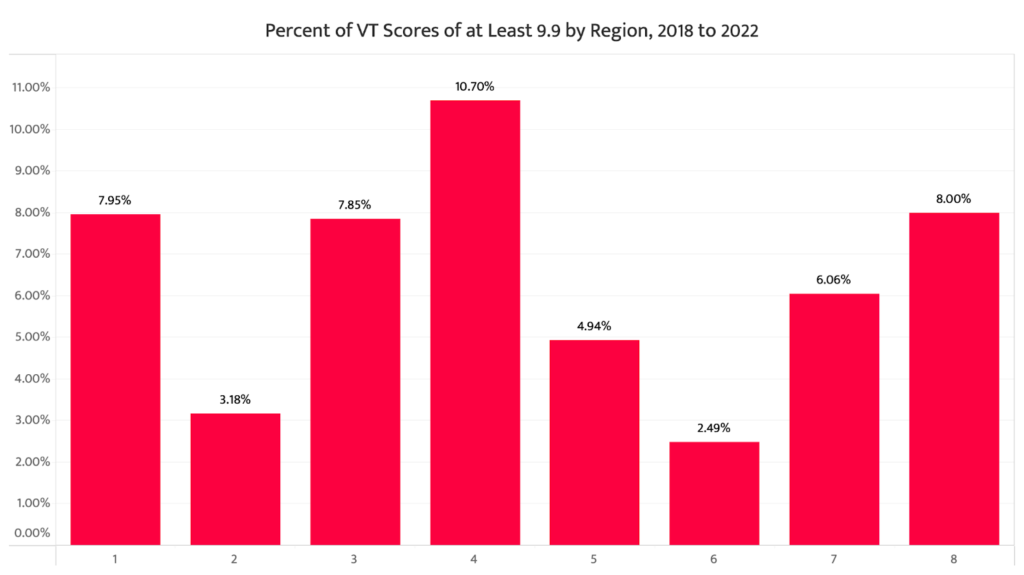
While scores over 9.9 are the most desirable, a 9.8 is a baseline good score. With those totals in mind, we examined the percentage of scores from each region that reached or exceeded each mark. On vault, nearly half of the scores from Region 1 exceeded 9.8 at 44.76%, while Region 3 and Region 8 sit around 40%. Regarding 9.9 scores, however, Region 4 has Region 1 and Region 8 beat.
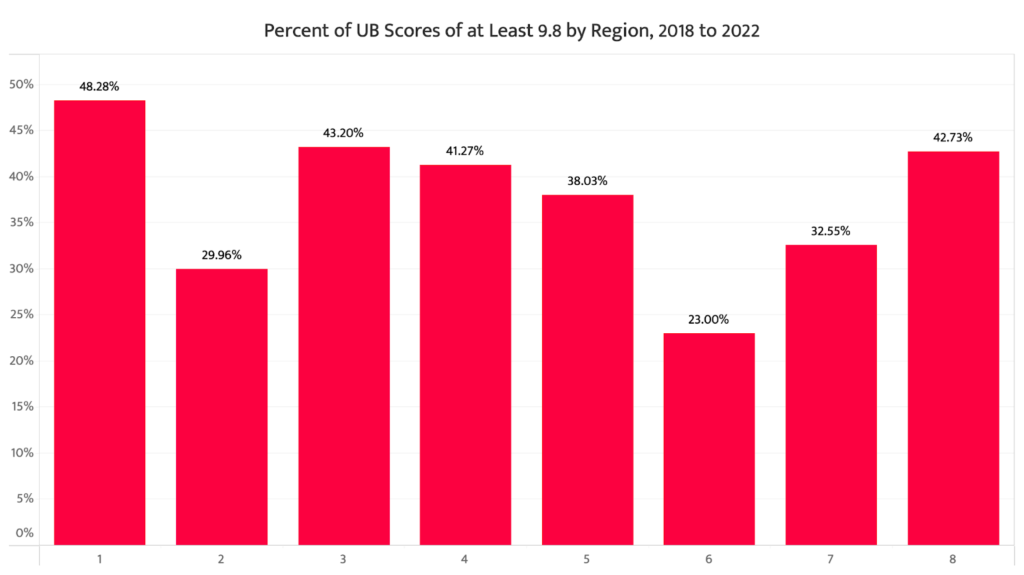
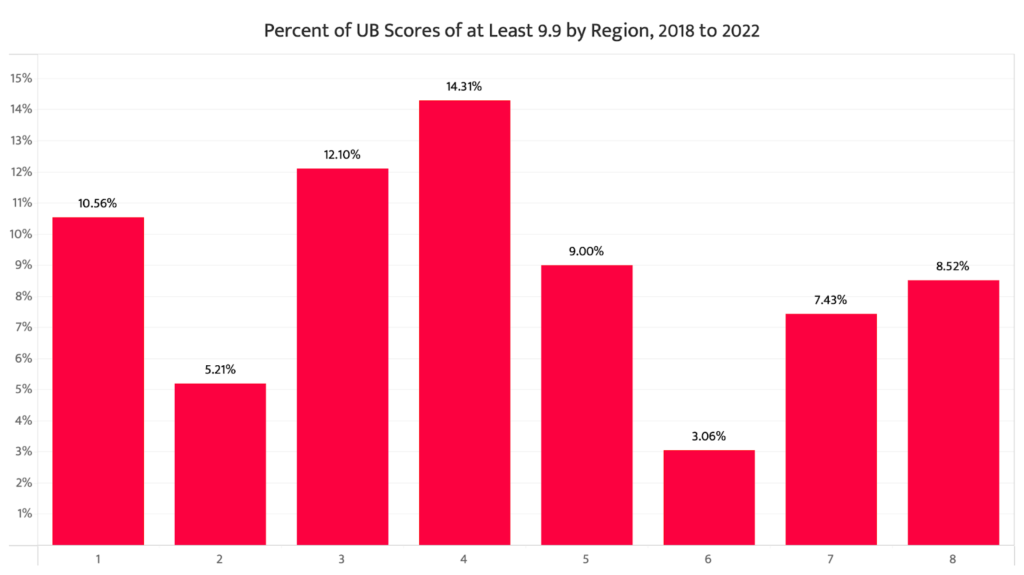
Bars presents a higher percentage of scores of 9.8 or higher across the board. The overall makeup is much the same as vault, though Region 3, Region 4, and Region 5 are closer together. The 9.9s tell a similar story, with Region 4 having the highest percentage over 9.9.
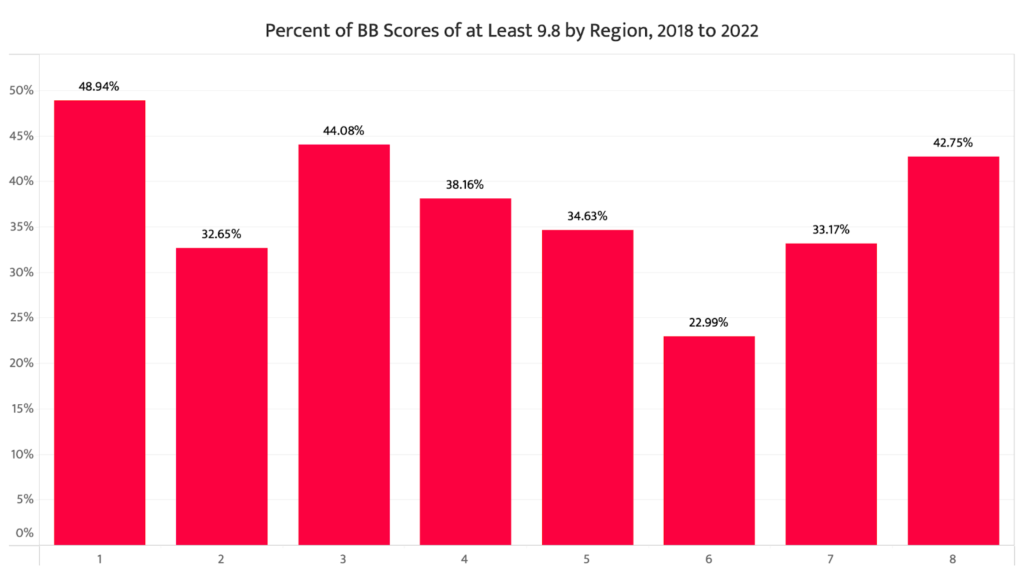
Beam continues the overall percentage trend for 9.8s, though Region 3 inches out Region 8 this time. The 9.9 percentages reach similar peaks for Region 1, Region 2, Region 3, and Region 4.
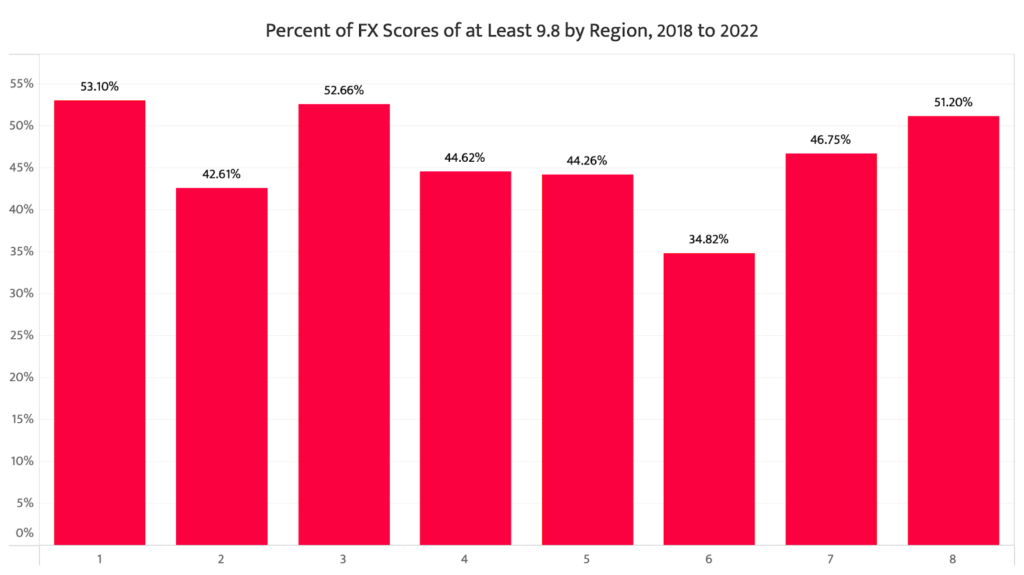
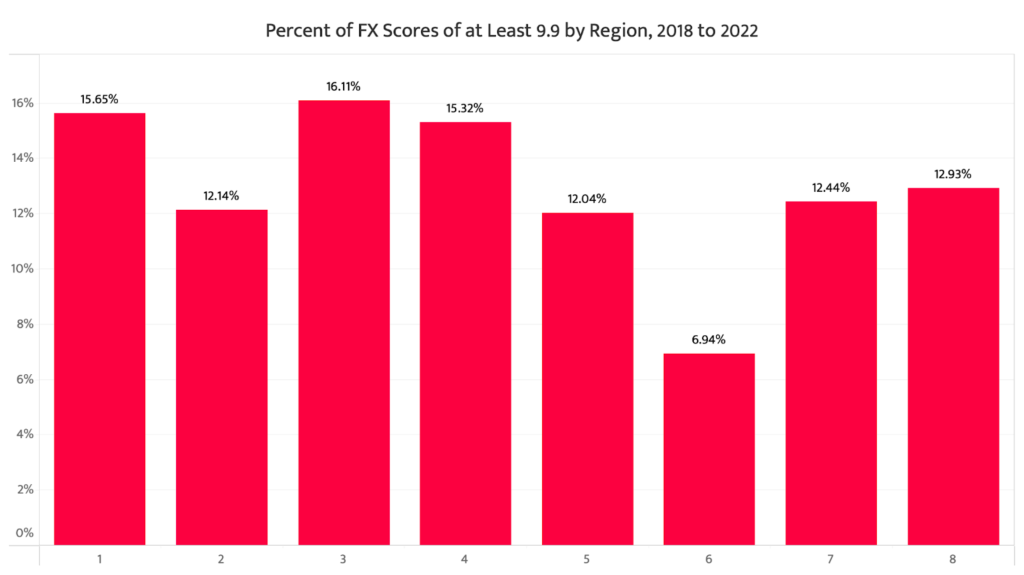
Again, the most parity of scores across regions comes on floor, and seven of the eight regions reach at least 40% of scores over 9.8. Region 3 boasts the highest percentage of its gymnasts’ scores, being 9.9 or higher, though Region 4 isn’t far behind.
While the next great college gymnast could come from anywhere, certain regions produce them more frequently. Region 1 and Region 8 most frequently produce solid gymnasts overall, but Region 3, Region 4, and Region 5 are close behind. The highest percentage of 9.9s or higher, though? It depends, but it usually comes down to Region 3 and Region 4.
READ THIS NEXT: Leotard Rankings: NCAA Nationals
Article by Tara Graeve, dataset provided by Dara Tan
Like what you see? Consider donating to support our efforts throughout the year! [wpedon id=”13158″]

One comment
Comments are closed.