The sound of a 10.0 is instantly recognizable on a broadcast. The team comes alive with joy, embracing their teammate in celebration of perfection. Fans watching from home often listen for a flawless routine’s score to be met with the screams of overjoyed gymnasts. They’re even egged along by the “10 Watch Cam” that ESPN uses to capture the gymnast’s reaction— if their routine were to be perfect. This has often ended in disappointment. Only two gymnasts received perfect scores this January, compared to 20 in January of 2024. Data editors Jenna King and Emma Hammerstrom analyzed score distributions through week six and compared them to prior seasons to answer the current hot-button topic in NCAA: Are scores really getting tighter? Former NCAA judge Rhiannon Franck joins us to provide insight from a judging perspective on why scores may be tighter this season.
Methodology
Data editor Jenna King compiled all scores of the first six weeks of the past four seasons (2022-2025). The editors chose to limit analysis to only the first six weeks to keep conclusions in the context of the first half of the season. After the season concludes, this analysis can be revisited to see if the same trends hold through the second half of the season. Data editor Emma Hammerstrom performed this analysis on four levels: overall scoring, event-level scoring, conference scoring, and division scoring. For each of those levels and each season, she compiled average scores, the percentage of 9.900+ scores, and the distribution of scores ranging from 9.700-10.0.
Are there more lower scores in 2025?

To start, we looked at the percentages of each score from 9.700 to 10.0. Indicated by the hot pink lines, we can see the trend that we’ve all been feeling. Incidences of lower scores (9.700 to 9.800) are much more common in 2025, while higher scores ranging from 9.850 to 10.0 are less common than in past seasons, especially compared to 2024.
This distribution validates what a lot of gymnastics fans have been sensing this season: that the scores just feel lower. The number of scores above a 9.8 have dropped dramatically in 2025 and those above 9.9 appear to be at their lowest in at least the last four years. Scores between 9.8 and 9.7 are noticeably more common this year. Assuming that all these scores are “hit” routines (i.e. no falls, major break and mostly starting from a 10.0), and assuming the gymnasts are performing at approximately the same level at the start of the 2025 season as previous seasons, the most obvious explanation for these changes is the judging. Judges often hear officials talk about how they “judge easier in college” or “take quarter tenths” or feel pressured by coaches and fans to throw out a high score to a fan-favorite who looked clean, even if there were technical deductions that few would notice. This data supports the fact that the judges have been seeing the deductions all along, they just haven’t been taking all of them. The challenge now will be to further separate the true 9.7 to 9.8 routines from the 9.4 to 9.65 routines. As hard as it is to give a 9.8 to a routine that might have scored a 9.9 last year, it’s even harder to break a dance or acrobatic series on beam, or devalue a leap pass on floor and flash a 9.7SV and a 9.45 score for an otherwise clean routine.
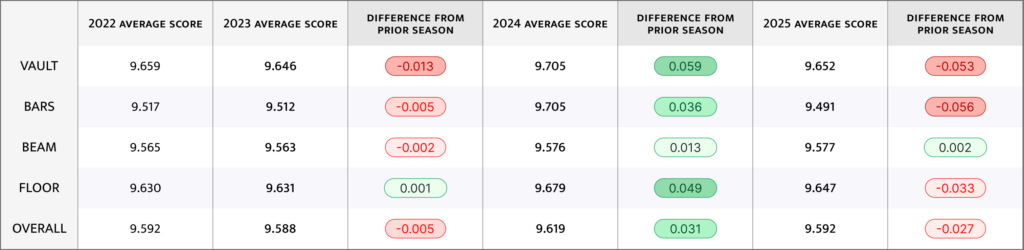
How have the average scores changed over the years?
Despite the higher volume of scores between 9.7 and 9.8 we saw above, looking at the average scores shows an interesting trend. The data revealed general stability in the average score from 2022 to 2023, then a large jump in 2024, followed by about an equal drop in scores in 2025. The average score over the first half of 2025 is about equal to the first halves of 2022 and 2023, with 2024 being the outlier year. It’s also important to notice that the differences in average scores we’re seeing are mostly a half or quarter tenth, where a half tenth is the smallest deduction a judge can take.
Looking at the data by event, the overall pattern holds across every event except beam. Beam average score has remained relatively consistent across the years, perhaps due to more obvious mistakes, such as balance checks, that judges take more consistently.
On a division level, we see the same trend of the average score dropping slightly into 2025. What differs is the trends that precede it. In the first half of 2023, Division II schools witnessed a large drop in average score, while Division I and III saw scores rise. This pattern resulted in the lack of increase overall we saw above. In 2024, Divisions II and III saw the biggest gains from the increase in scoring, with Division III scores increasing by almost a full tenth. With lower scores historically, these divisions have more room to take advantage of looser scores. Divisions II and III have also seen a smaller decrease in scores in 2025 than Division I, with Division I seeing a decrease of approximately a quarter tenth in the average score in 2025.
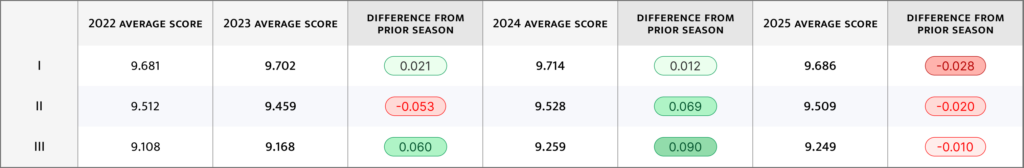
* Division III includes NCGA and NAIA teams.
On a conference level, we see more variance. The ACC, NCGA, and MPSF (as well as lone Pac-12 member Oregon State) have seen scores slightly rise! Meanwhile, the Big 10, EAGL, and MAC have taken larger dips than other conferences. Conferences were assigned based on a teams current conference in 2025 (so for example Stanford and California are represented in the ACC average score across all four years).
More variance on this level is expected, since talent level on individual teams and within conferences can vary more from year to year. The SEC, which some can argue gets the most consistent top talent and has the highest average score across all years, sees the most consistent pattern with average scores increasing by about one one-hundredth of a point in 2023 and 2024, and then dropping by the same amount in 2025.
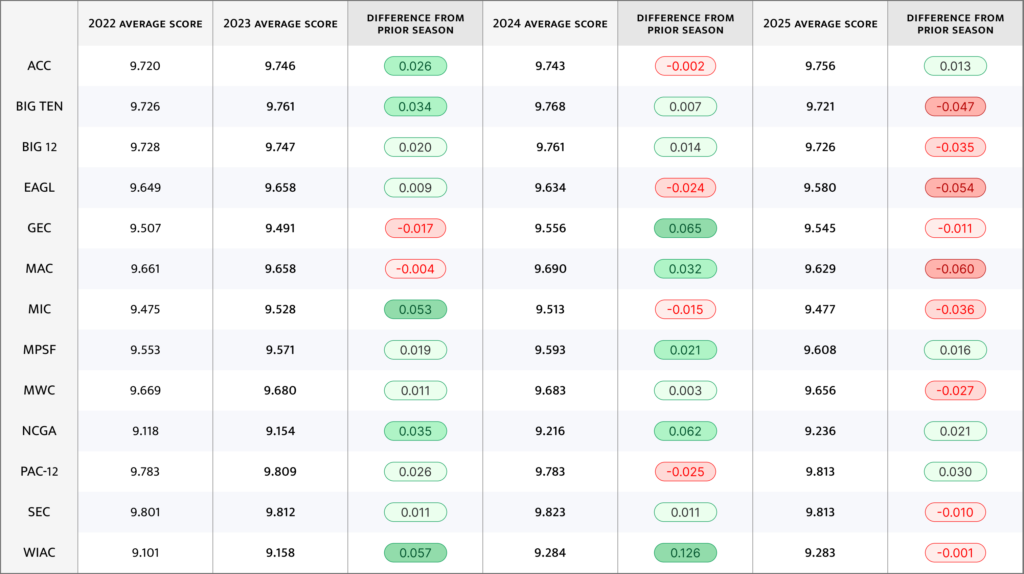
From a judge’s perspective, the most obvious change between 2024 and 2025 is the addition of the WCGA-run judge’s evaluation system, known as the SCORE Board. This new system promised to rank judges based on their accuracy following an evaluation of their scoring, and it seems like judges responded accordingly. It’s interesting to note that while the SEC has the highest averages of any conference, its average scores have been relatively unchanged throughout the four-year period. With a clear recruiting advantage, the SEC is often able to bring in more top recruits than other conferences. Additional changes in the NCAA code that make it harder to start from a 10.0 may have affected conferences with lower recruiting power, challenging some athletes to perform skills that may not be 100% mastered early in the season, resulting in a lower score.
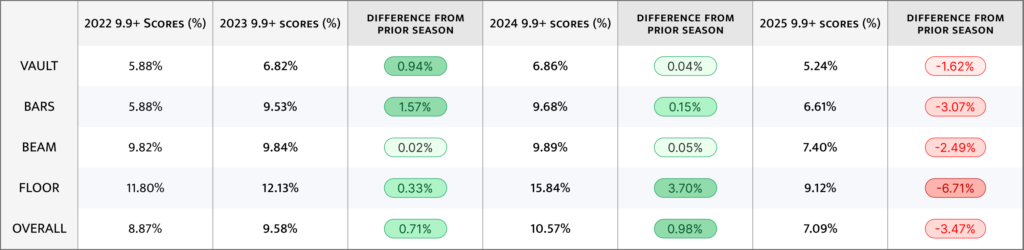
Are fewer 9.900+ scores being given out this season?
Average scores can be influenced by outliers from obvious large mistakes. What is more noticeable to the average viewer is the rate of 9.9+ scores, which have decreased significantly in 2025. Overall, the percentage of 9.9+ scores increased by almost 1% each year from 2022 to 2023 to 2024, but then saw a sharp correction in 2025 and dropped by 3.5% resulting in even fewer 9.9+ scores in 2025 than in 2022.
The most stark difference is on floor, where over 15% of scores were a 9.900 or higher in the first six weeks of 2024 and saw the largest correction in 2025 to drop to just 9%. The rates of 9.9+ scores are lower in 2025 across all four events than they were in any of the previous three years.
The table below shows the percentage of 9.900+ scores given on each event in each season, and the difference columns demonstrate the changes across seasons.
On a divisional level, only the Division I teams have seen a similar drop in scores above 9.900. Division III was largely unaffected, but this can be attributed to the lower rates of 9.900 scores in that division.

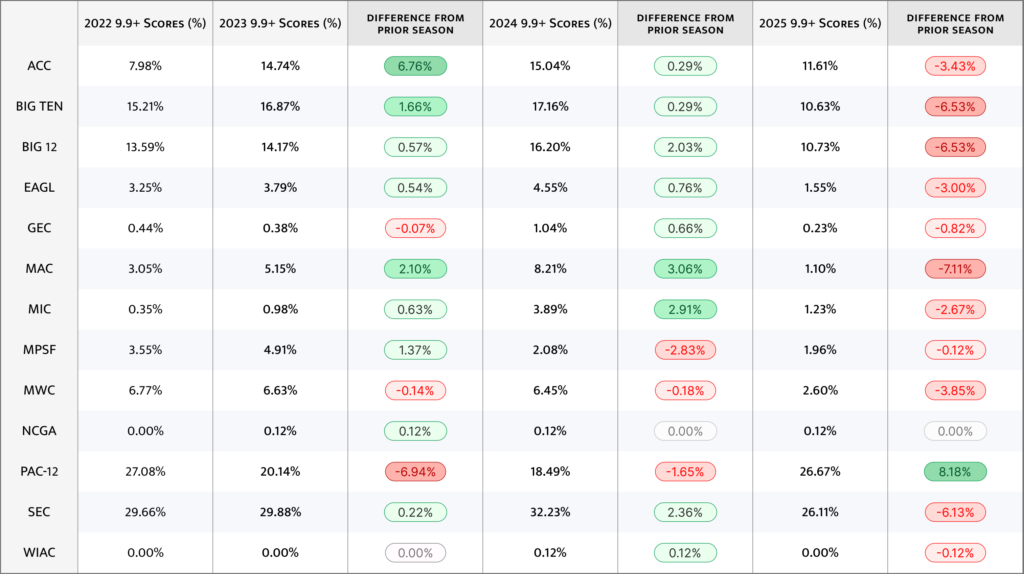
On a conference level, we see similar trends. The SEC, Big Ten, Big 12, and MAC have seen the largest drops in percentage of 9.900+ scores in 2025. The MSPF, NCGA, and WIAC have been largely immune from these trends, again likely due to 9.9+ scores being rare in these conferences.
From a judging perspective, this is where the introduction of the SCORE Board has potentially had the biggest impact. Judges would previously “judge in quarter tenths,” meaning if they saw a flexed foot here or a tiny knee bend there, they’d only take 0.025, essentially only taking half of the minor deductions that they see. With the highest-performing conferences, these tiny deductions are often all there is to take on these routines, which keeps the score relatively high. Now, with the threat of being evaluated by a panel of judges, if a gymnast has four tiny deductions, she’ll be earning a 9.8 rather than a 9.9. The NCAA judge’s education committee has also stressed taking more amplitude and dynamics on vault, appropriate landing deductions on floor (posture as well as control), and being stricter with dance pass deductions. This could help explain why vault has yet to have any 10.0s this season, and floor has had the largest decrease in number of 9.9+ scores. The code of points also made it more difficult to start from a 10.0 with a two-pass routine compared to last year, which may also explain why the scores are lower as gymnasts and coaches work to find the best composition under the new requirements.
Overall, we do see clear trends of scores dropping in the 2025 season. The mean score dropped on every event but beam, and the majority of divisions and conferences had their mean score drop as well in 2025. The data revealed significant drops in the percentage of 9.900+ scores this season, especially compared to the 2024 season. Top coaches, such as Jay Clark and KJ Kindler, have publicly lamented the lower scoring this season, and the data proves them right— the SEC had a 6% drop in 9.900+ scores this season. Whether this trend holds into the second half of the season is yet to be seen, but fans will continue to hold their breath in anticipation of their favorite gymnast achieving a much rarer 10.0 this season.
READ THIS NEXT: WCGA Releases SCORE Board Details
Article by Emma Hammerstrom, Rhiannon Franck, Claire Harmon and Jenna King